Grant Funding Statistics 2026: State Portals Now Hold $11.5B, More Than Grants.gov
Original August 2026 data: state and local portals carry $11.5B across 808 open grants while Grants.gov carries $9.5B across 1,709. Open funding rose 94% to $21.0B.

Last updated: August 12, 2026
The grant funding statistics 2026 picture flipped this month. On August 9, 2026, GrantCue's live catalog held 2,517 active opportunities worth an estimated $21.0 billion. State and local portals accounted for 808 of them, carrying $11.5 billion. Grants.gov accounted for 1,709, carrying $9.5 billion. The state layer lists under half as many opportunities and still holds more trackable money.
Second edition of a monthly series. The July 2026 snapshot covered $10.8 billion across 2,670 opportunities.
Charts and statistics may be republished with credit and a link back to this report.
Quick Answer: How Much Grant Funding Is Open in August 2026?
- $21.0 billion in estimated funding is open across tracked federal, state, and local sources ($21,006,768,451).
- 2,517 opportunities are active. 1,477 of them publish a future deadline.
- State and local portals hold $11.5 billion across 808 opportunities. Grants.gov holds $9.5 billion across 1,709.
- 481 opportunities, or 19.1% of everything open, close within 30 days.
- The median award ceiling is $630,000, up from $500,000 in July.
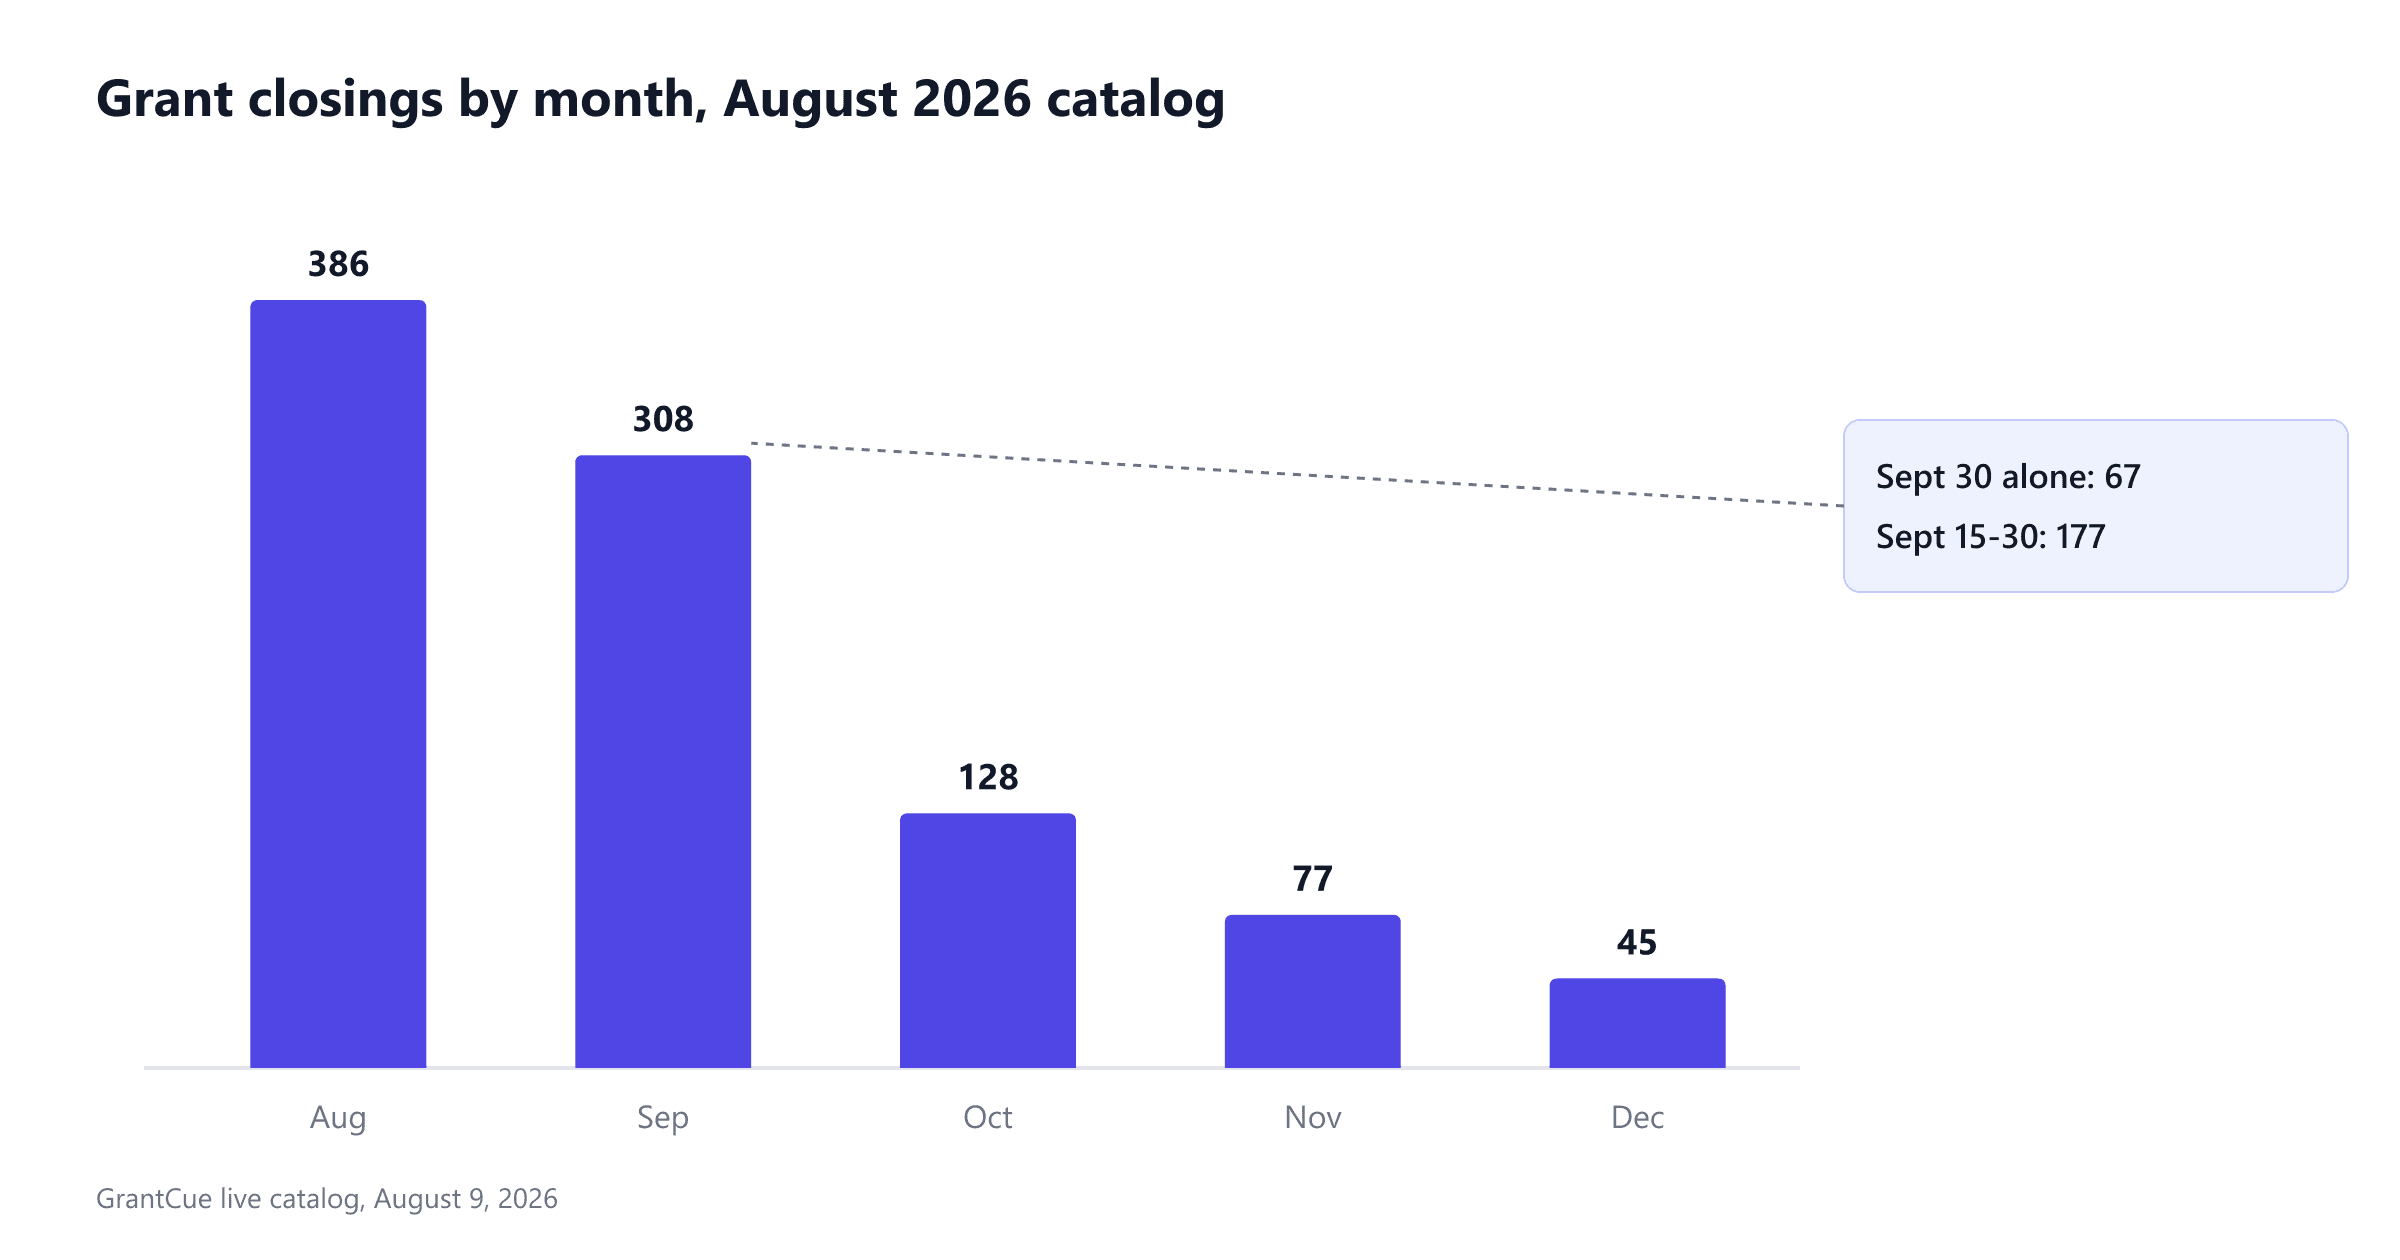
- 308 opportunities close in September and 67 of those close on September 30.
The State Layer Now Holds More Money Than Grants.gov
State and local portals carry 32.1% of open opportunities and 54.8% of published dollars.
| Source | Open opportunities | Share of opportunities | Published funding | Share of dollars |
|---|---|---|---|---|
| State and local portals | 808 | 32.1% | $11.5B | 54.8% |
| Grants.gov | 1,709 | 67.9% | $9.5B | 45.2% |
| Total | 2,517 | 100% | $21.0B | 100% |
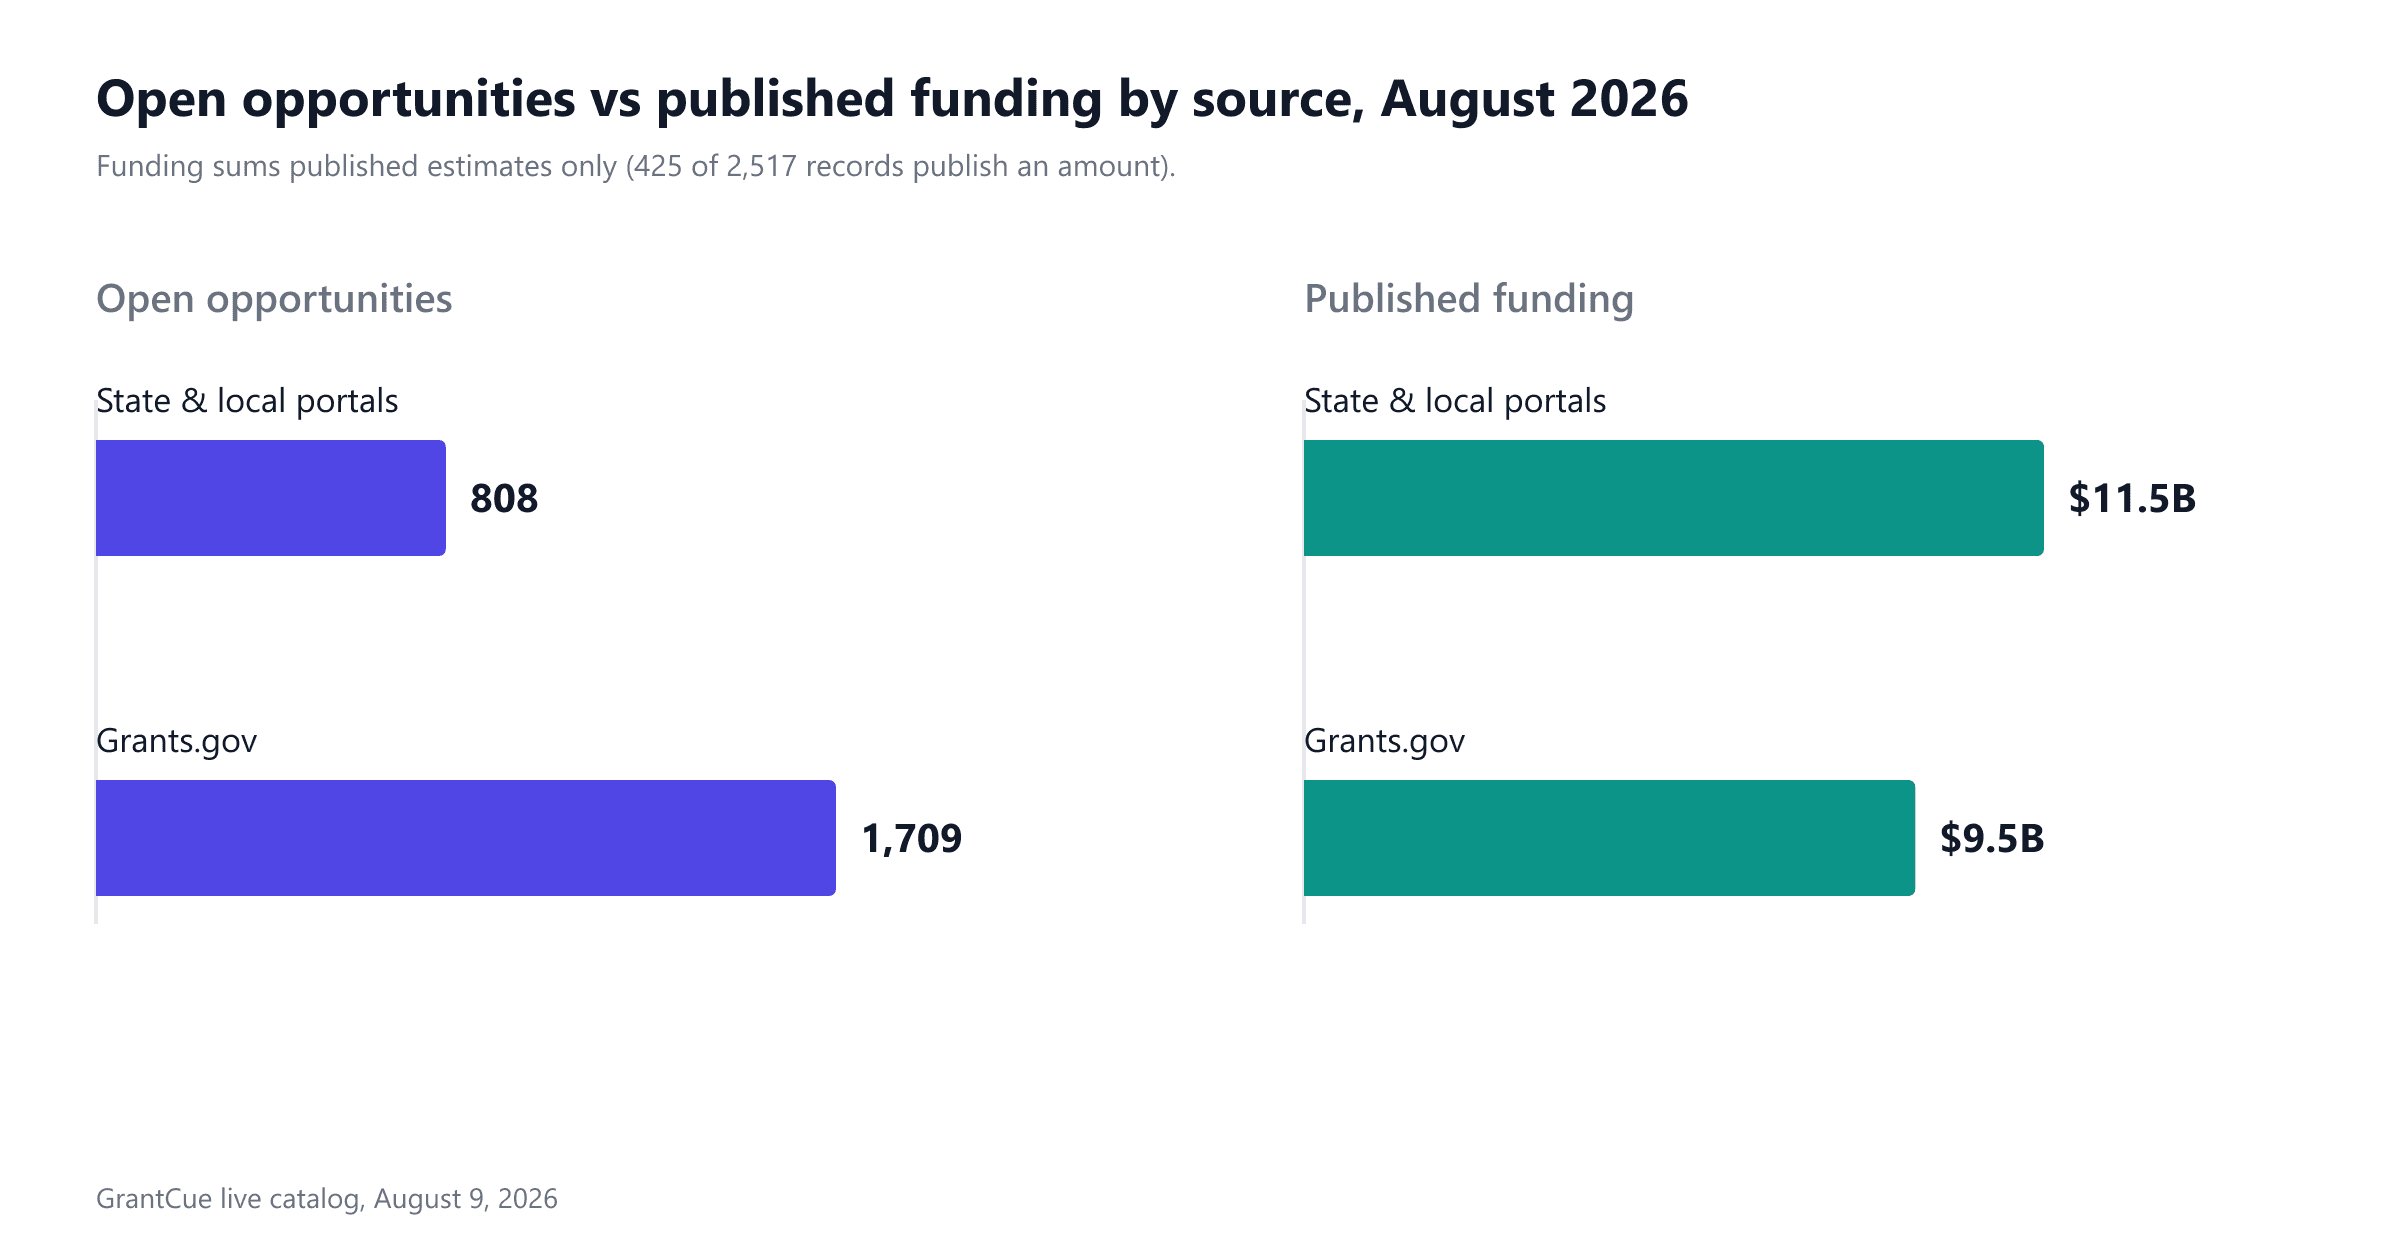
There is a regulatory reason for the gap. 2 CFR 200.204(a) requires a federal agency to display summary information on Grants.gov ahead of the full announcement. Paragraph (a)(6) then qualifies the funding details with "to the extent appropriate," which leaves the dollar fields optional in practice (eCFR, checked August 9, 2026). State-administered programs sit on their own state portal instead, and those portals usually publish a program appropriation up front because it came out of a state budget line.
Leaders by portal in August: California 157, Illinois 132, Pennsylvania 78, Michigan 59, Texas 57, West Virginia 44, Massachusetts 44, Iowa 35, Maine 27, Washington 21, Montana 20, Nebraska 18, New York 17, Arizona 15, Ohio 15, Rhode Island 13, Clinton County PA 13, New Jersey 11, Utah 6, Virginia 5, Indiana 5.
No single search covers these, because the software differs by jurisdiction: eCivis in Arizona, Rhode Island, and Indiana; WebGrants in Iowa; GATA in Illinois; SharePoint in West Virginia; Amplifund in Nebraska; ServiceNow in Montana. Pulling them into one searchable catalog alongside Grants.gov is most of the work behind these numbers. July's report drew on 14+ portals with live records. This one draws on 27.
Grant Funding Statistics 2026: July vs August
Open funding rose 94% in one month while active opportunities fell 5.7%.
| Metric | July 2026 | August 2026 | Change |
|---|---|---|---|
| Active opportunities | 2,670 | 2,517 | -153 |
| Estimated open funding | $10.8B | $21.0B | +94% |
| Opportunities with a future deadline | 1,505 | 1,477 | -28 |
| Closing within 30 days | 518 | 481 | -37 |
| Closing within 60 days | 703 | 741 | +38 |
| Closing within 90 days | 850 | 850 | no change |
| Median award ceiling | $500,000 | $630,000 | +$130,000 |
| Average award ceiling | $4,566,843 | $12,071,076 | +164% |
| Records with no normalized category | about 86% | 81.3% | roughly 5 points lower |
561 opportunities entered the catalog in the 30 days before August 9. Do not read the funding jump as 94% more grants for the average applicant. The average published ceiling nearly tripled over the same period, so a handful of very large programs moved the total more than the 561 new listings did.
The September 30 Cliff
The federal fiscal year ends September 30. 31 U.S.C. 1102 sets the fiscal year of the Treasury to begin on October 1 of each year and end on September 30 of the following year (U.S. House Office of the Law Revision Counsel, checked August 9, 2026). Deadlines cluster against that date, then fall away.
| Closing month | Opportunities (all tracked sources) |
|---|---|
| August 2026 | 386 |
| September 2026 | 308 |
| October 2026 | 128 |
| November 2026 | 77 |
| December 2026 | 45 |
Inside September, 177 opportunities close between the 15th and the 30th, and 67 close on September 30 itself. Then the count drops 58%, from 308 in September to 128 in October.
Statute drives the cluster. 31 U.S.C. 1502(a) makes the balance of an appropriation limited to a definite period available only for expenses properly incurred during that period, so agencies with expiring authority close competitions before the year turns over. NIH standard due dates reinforce the pattern: new SBIR and STTR applications are due September 5, and new P-series and T-series applications September 25 (NIH standard due dates, checked August 9, 2026). Teams chasing SBIR and STTR funding should plan against early September rather than the end of the month.
A proposal you have not started by late August is unlikely to clear that wall. Put the 481 near-term closings on a shared grant calendar and triage by eligibility before writing anything.
The fiscal-year-end deadline calendar turns this cluster into a week-by-week run-up plan.
The Median Award Ceiling Rose to $630,000
An award ceiling is the maximum dollar amount a funder states it will give a single recipient under a program. The median ceiling among open opportunities is $630,000 in August, up from $500,000 in July. The average is $12,071,076.
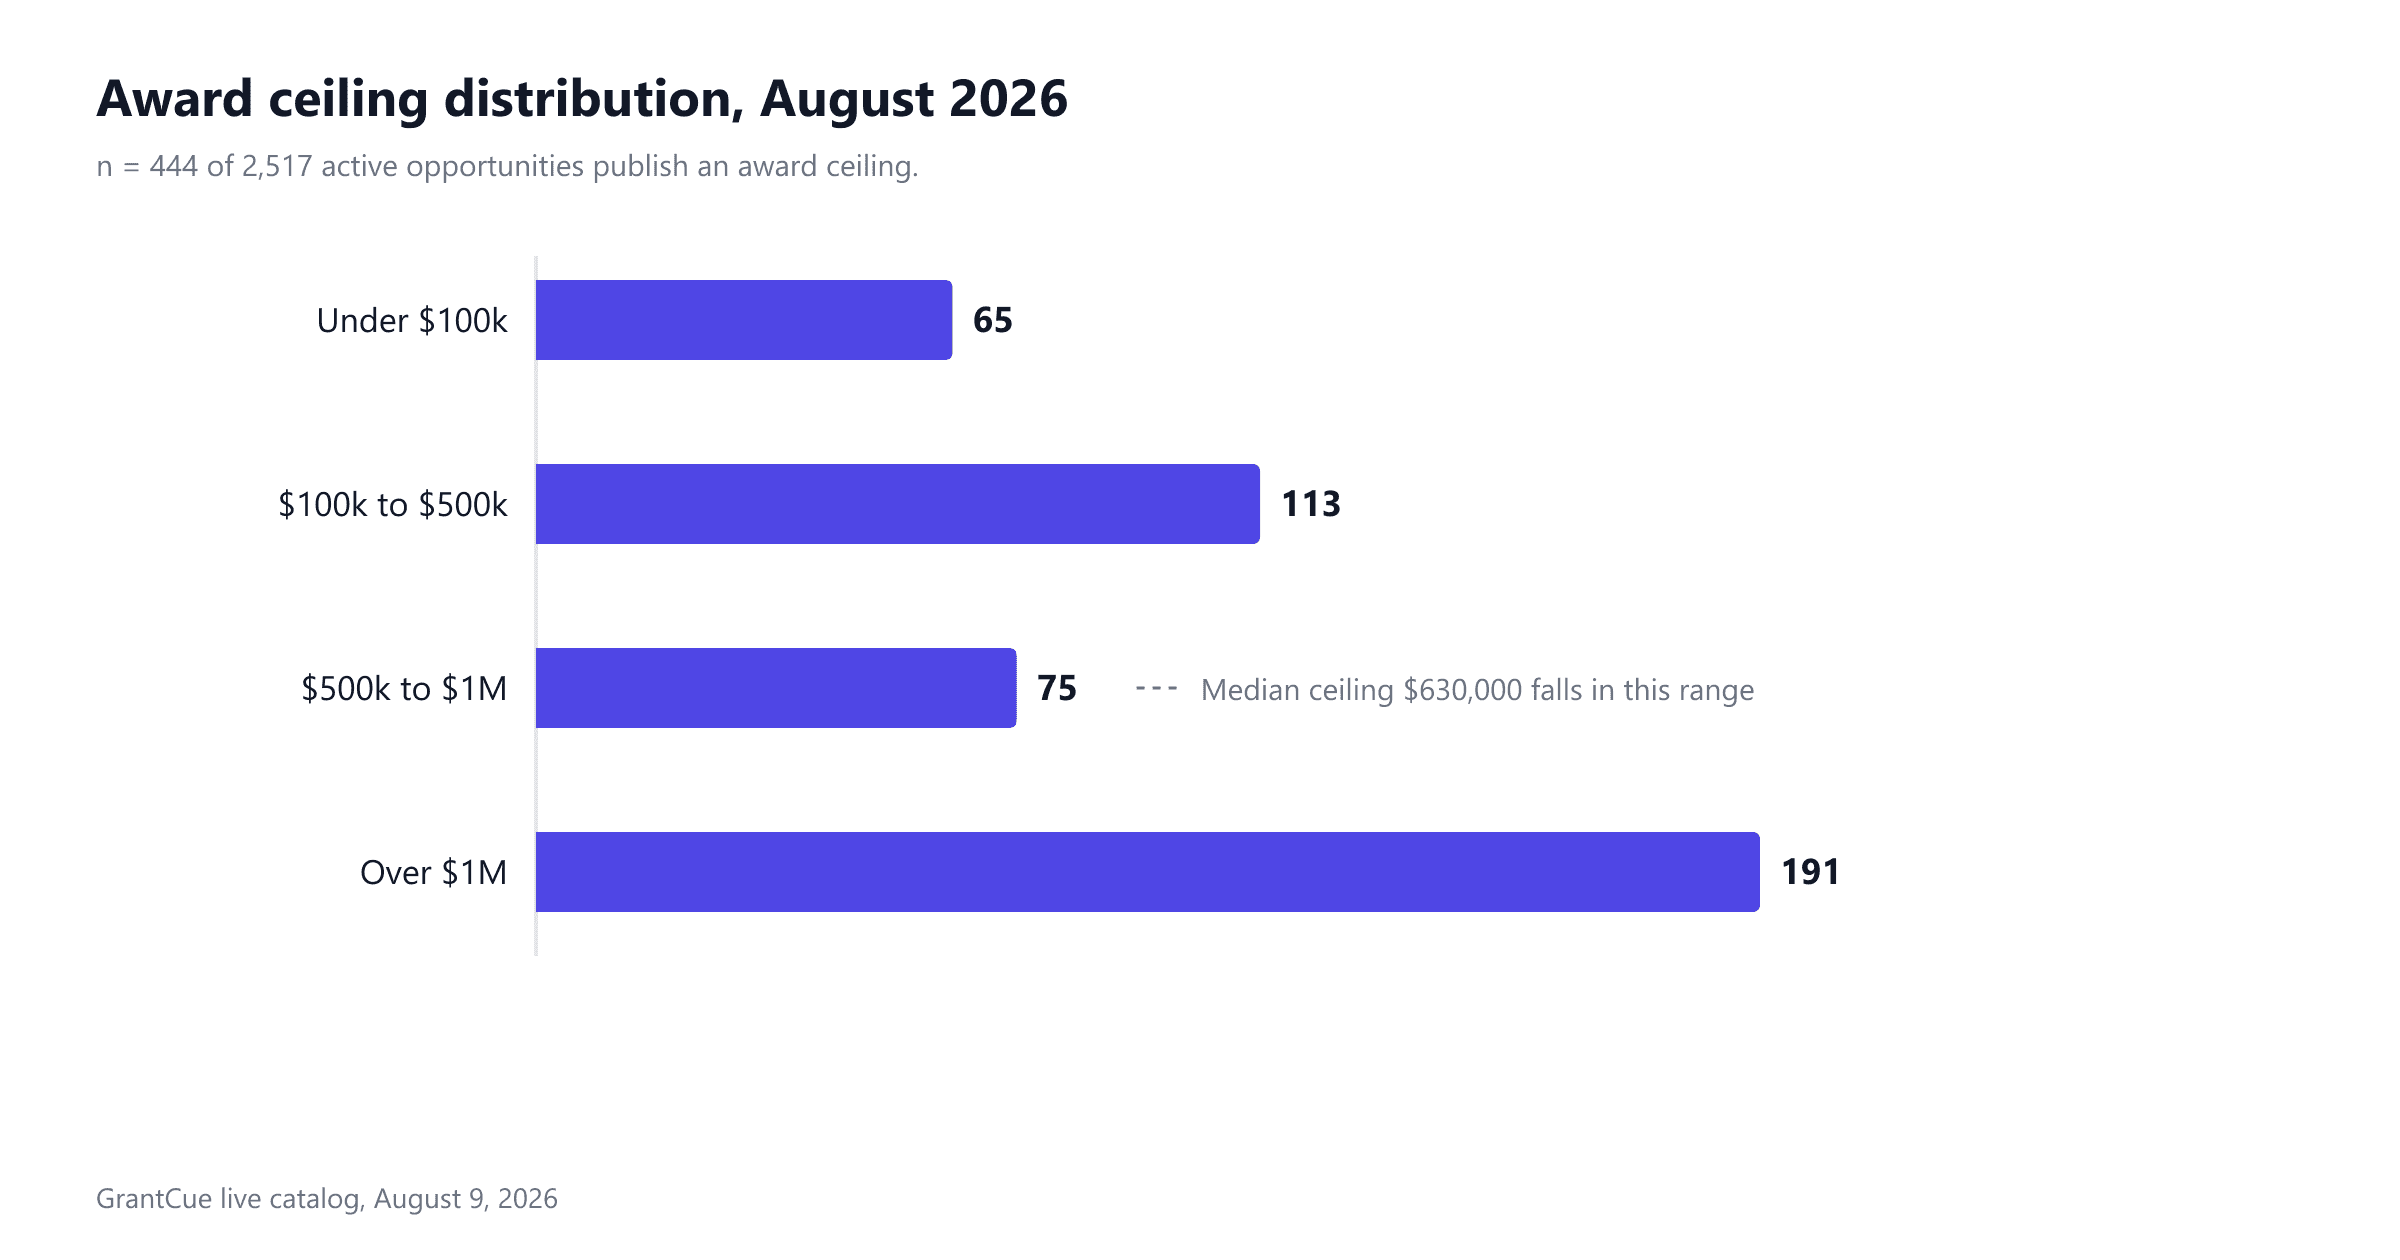
When the average sits 19 times above the median, a few enormous programs are distorting the picture. The distribution across the 444 records publishing a ceiling:
| Award ceiling | Opportunities |
|---|---|
| Under $100,000 | 65 |
| $100,000 to $500,000 | 113 |
| $500,000 to $1,000,000 | 75 |
| Over $1,000,000 | 191 |
178 of the 444 published ceilings sit at or below $500,000. That is the band where a small nonprofit or a two-person research team actually competes, well away from the eight-figure programs behind the press releases.
Only 4.2% of Open Grants Require a Match
105 of 2,517 active opportunities carry a cost sharing or match requirement, which is 4.2%. Cost sharing is the portion of project costs a recipient covers from sources other than the federal award. Most open grants in the August 2026 catalog ask for no match at all.
Federal policy points the same way. 2 CFR 200.306(a) states that voluntary committed cost sharing is not expected under federal research grants, and that an agency may not use it as a factor during merit review unless a federal statute or agency regulation authorizes it and the notice of funding opportunity specifies it (eCFR, checked August 9, 2026). Cost sharing rules sit inside the Uniform Guidance at 2 CFR 200.
One caveat on the 4.2%: that count reflects records carrying a structured cost sharing flag. A match buried in an announcement's body text would not appear here, so read the notice before assuming there is none.
Who Is Funding: The Agency League Table
NIH posts 685 open opportunities, which is 27.2% of the whole catalog and 40.1% of everything on Grants.gov.
| Funder | Active opportunities |
|---|---|
| National Institutes of Health | 685 |
| U.S. National Science Foundation | 168 |
| Defense Health Agency | 101 |
| Food and Drug Administration | 59 |
| Texas Education Agency | 57 |
| Centers for Disease Control and Prevention | 49 |
| Health Resources and Services Administration | 35 |
| Department of Housing and Urban Development | 19 |
| Federal Emergency Management Agency | 17 |
NIH alone posts more open opportunities than the next five funders combined. Fifth place goes to the Texas Education Agency with 57 open opportunities, ahead of both the CDC and HRSA. A state education department out-posting two federal health agencies never shows up in a Grants.gov-only search.
Among the 18.7% of records carrying a normalized category, the leaders are Education 80, Environment and Water 57, Community and Economic Development 52, Disadvantaged Communities 45, Health and Human Services 31, and Agriculture 17. The other 81.3% arrive with no usable category, which is why every opportunity goes through AI enrichment before reaching search.
Methodology
Figures reflect active opportunities in GrantCue's catalog as of August 9, 2026, aggregated from Grants.gov and 31 state and state-agency sources across 28 states, 27 of which carried active opportunities in this pull. Dollar totals sum published estimated funding only. 83% of records publish no amount, so every total here is a floor, not a census.
One record listing exactly $2,147,483,647 was excluded from all dollar figures. That value is the maximum of a signed 32-bit integer, an overflow sentinel in the source feed rather than a real award. Leaving it in would have added over $2 billion of fiction.
This report describes what GrantCue tracks, not every grant in America. Foundation and corporate giving fall outside these numbers.
Charts and statistics may be republished with credit and a link to this page.
To work these same sources yourself, start with how to find grants for nonprofits.
FAQ
How much grant money is available right now?
Across the federal, state, and local sources GrantCue tracks, an estimated $21.0 billion was open on August 9, 2026, across 2,517 active opportunities. Because 83% of records publish no dollar amount, the real figure is higher.
Do state grant portals list different grants than Grants.gov?
Yes. In August 2026, 808 of the 2,517 active opportunities GrantCue tracked came from official state and local portals rather than Grants.gov. Those 808 carry $11.5 billion in published funding, more than the $9.5 billion attached to 1,709 Grants.gov listings.
What is the typical grant award size in 2026?
The median award ceiling among open opportunities is $630,000. The average of $12,071,076 runs about 19 times higher because 191 programs publish ceilings above $1 million.
Why do so many grant listings show no dollar amount?
2 CFR 200.204(a)(6) asks federal agencies to publish the total amount they expect to award "to the extent appropriate," which leaves the dollar fields optional in practice. Only 425 of 2,517 active records in the August 2026 catalog, or 17%, publish an amount.
How many grants close on September 30, 2026?
67 opportunities in the August 2026 catalog close on September 30, and 177 close between September 15 and September 30. September carries 308 closings in total, against 128 in October.
How often is this grant funding data updated?
GrantCue syncs its sources daily and publishes this snapshot monthly. Tracking these deadlines across a portfolio is the reporting side of grants lifecycle management.
---
Every number in this report comes from the same live catalog GrantCue users search. Search open federal and state grants free.