Grant Pipeline Management: Dashboard, Stages, and Workflow for Nonprofits
A guide to grant pipeline management and dashboards for nonprofits, including stages, metrics, ownership, deadlines, and reporting.

In this article (36)
- Quick Answer: What Stages Should a Grant Pipeline Include?
- Why Grant Pipelines Work Better Than Lists
- Dashboard Metrics
- Pipeline and Calendar
- Visual Pipeline vs Spreadsheet
- Common Mistakes
- Mistake 1: Too Many Stages
- Mistake 2: No Stage Definitions
- Mistake 3: Treating Awarded as Finished
- Grant Pipeline vs Grant Tracker
- Recommended Dashboard Sections
- Stage Definitions
- Pipeline Metrics That Matter
- Pipeline Review Meeting
- Example Leadership Dashboard Narrative
- Data Quality Rules
- Qualification Score in the Dashboard
- Forecasting With Pipeline Data
- Blocker Flags
- Stage Aging
- Dashboard QA Checklist
- Dashboard Views by Audience
- Pipeline Health Indicators
- Example Dashboard Policy
- What the dashboard needs to answer
- Example Pipeline Report
- Pipeline Governance
- Pipeline Dashboard Template
- Example Dashboard Cleanup Routine
- Example Stage Movement Rules
- FAQ
- What is a grant pipeline?
- What is a grant management dashboard?
- How often should a grant pipeline be reviewed?
- Next Step
- Sources and Further Reading
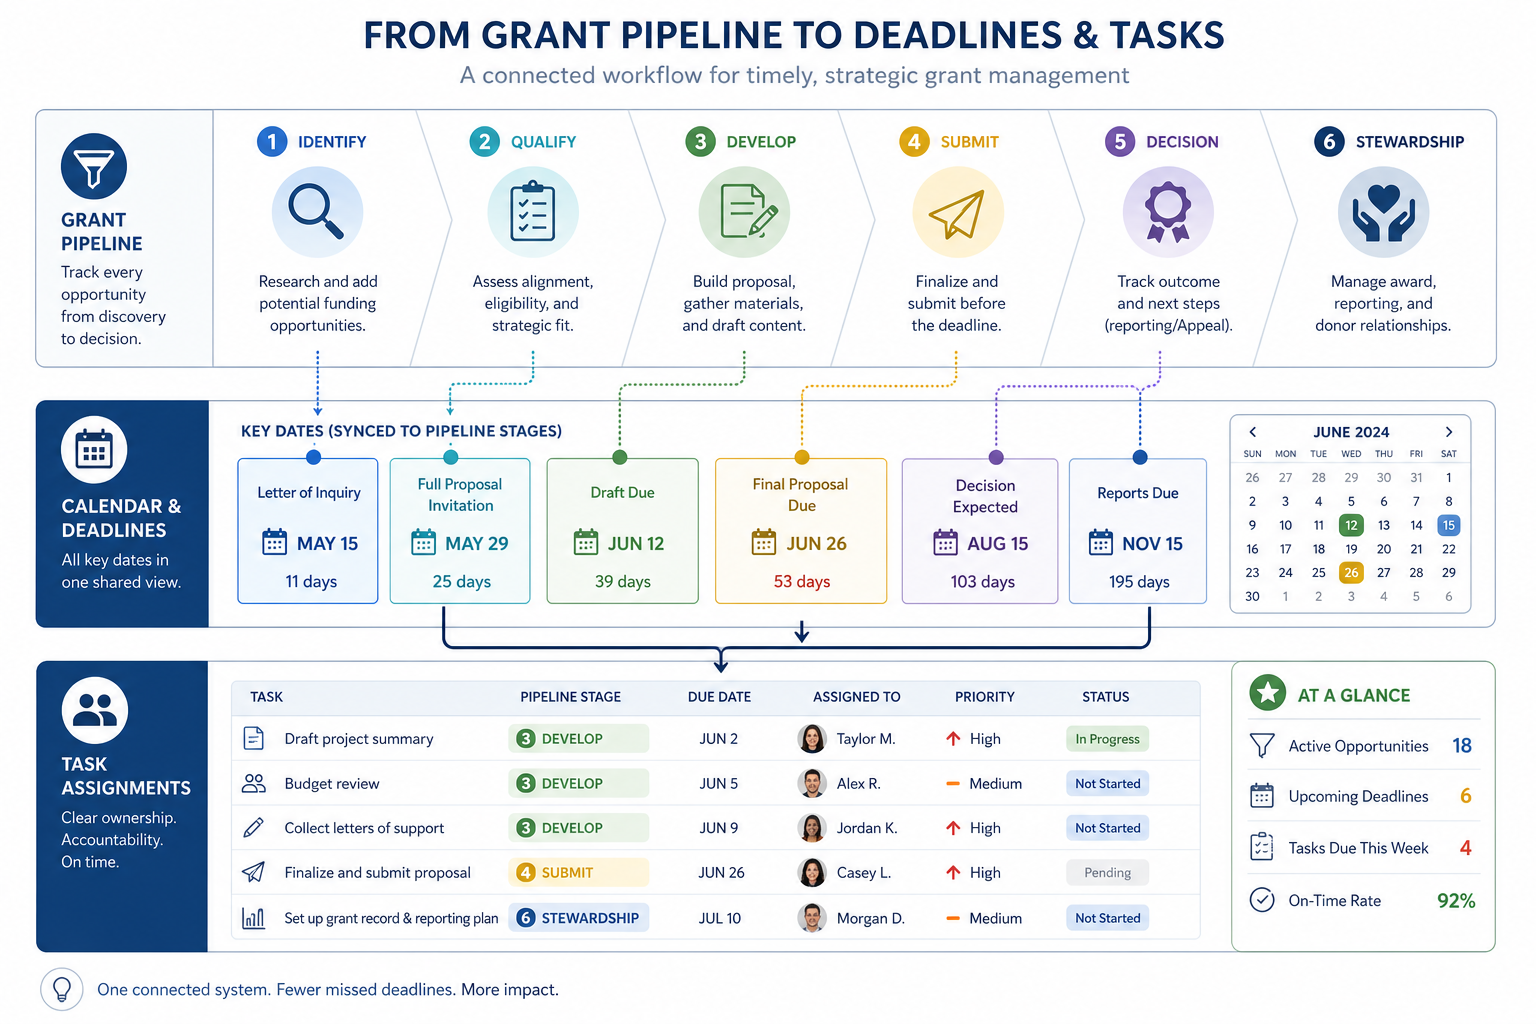
Grant pipeline management is the process of tracking funding opportunities from discovery to qualification, drafting, submission, award, reporting, and closeout. A grant pipeline dashboard helps teams see what is active, what is due, who owns each grant, and where bottlenecks are forming.
For most teams, the pipeline should be part of grant management software for nonprofits.
Quick Answer: What Stages Should a Grant Pipeline Include?
Why Grant Pipelines Work Better Than Lists
A list tells you what grants exist. A pipeline tells you what is happening.
Pipeline views make it easier to answer:
- Which grants are active?
- Which deadlines are coming?
- Which proposals are stuck?
- Who owns each opportunity?
- How much funding is in play?
- Which awards need reports?

Dashboard Metrics
Track:
- Active opportunities.
- Amount requested.
- Amount awarded.
- Upcoming deadlines.
- Submitted grants.
- Win rate.
- Time to submission.
- Reports due.
- Grants by owner.
- Grants by stage.
Pipeline and Calendar
A pipeline is strongest when connected to a grant calendar. The stage tells the team what kind of work is happening. The calendar tells the team when it must be done.
Visual Pipeline vs Spreadsheet
For a deeper view of kanban-style grant work, see the visual grant pipeline guide.
Common Mistakes
Mistake 1: Too Many Stages
Start with simple stages. Add complexity only when the team needs it.
Mistake 2: No Stage Definitions
Define what it means to move a grant from researching to qualified or from drafting to review.
Mistake 3: Treating Awarded as Finished
Awarded grants move into reporting, compliance, budget tracking, and closeout. The stages after the award are covered in the lifecycle management guide.
Grant Pipeline vs Grant Tracker
A tracker records information. A pipeline shows movement. That distinction matters because grant work has decisions, stages, owners, and deadlines. A static tracker can tell you that a grant exists. A pipeline dashboard tells you whether it is moving, blocked, submitted, awarded, or at risk.
The dashboard should answer: what are we pursuing, what is due soon, what is pending, what was awarded, and what needs action?
Recommended Dashboard Sections
A strong dashboard includes:
- Pipeline by stage.
- Deadlines next 30 days.
- Reports due next 60 days.
- Pending request amount.
- Awarded amount.
- Declined amount.
- Opportunities by owner.
- Opportunities by program area.
- High-fit opportunities.
- At-risk grants.
Do not crowd the dashboard with every field. The dashboard should guide decisions.
Stage Definitions
Use clear definitions:
Stage definitions prevent one person's "planning" from meaning another person's "drafting."
Pipeline Metrics That Matter
Avoid vanity metrics. A dashboard with 30 charts may look impressive but fail to guide action.
Pipeline Review Meeting
Use this agenda:
- Review deadlines in the next 30 days.
- Review reports in the next 60 days.
- Move stalled grants or assign next actions.
- Confirm budget review needs.
- Decide whether to pursue new opportunities.
- Archive low-fit opportunities.
- Update leadership notes.
The meeting should update the pipeline live. If the team takes notes elsewhere and updates later, the dashboard will drift.
Example Leadership Dashboard Narrative
"The organization has 18 active opportunities in the pipeline, totaling $1.2 million in potential requests. Four applications are due in the next 30 days, and three awarded grants have reports due in the next 60 days. Two proposals are blocked pending finance review. The team declined six low-fit opportunities this quarter before drafting, freeing capacity for higher-priority funders."
This kind of narrative helps leaders understand both revenue and workload.
Data Quality Rules
- No active grant without an owner.
- No deadline without a source.
- No submitted grant without request amount.
- No awarded grant without report dates.
- No stage movement without next action.
- No duplicate funder records.
These rules keep the dashboard trustworthy. Most teams enforce them inside a shared nonprofit grant management system rather than by hand, so the data stays consistent as more people update it.
Qualification Score in the Dashboard
Add a simple fit score before drafting:
Total score helps prioritize. A low score does not always mean "do not apply," but it forces a conversation before staff spend writing time.
Forecasting With Pipeline Data
A dashboard can support revenue forecasting when it includes request amount, probability, and expected decision date.
Example:
Weighted forecasts should be used carefully. They are estimates, not promises. But they help leadership understand possible revenue.
Blocker Flags
Use flags to show what is preventing progress:
- Budget needed.
- Program details needed.
- Attachment missing.
- Leadership approval needed.
- Partner letter needed.
- Funder question pending.
- Report data needed.
- Finance review needed.
Flags are more useful than long notes because they help the team scan for action.
Stage Aging
Stage aging shows how long a grant has been in one stage. If an opportunity sits in Qualifying for 45 days, the team may need to decide whether to apply or archive it. If a submitted grant has no decision date, someone may need to follow up.
Use stage aging to find stale work:
- Watch over 90 days with no next action.
- Qualifying over 30 days.
- Drafting with no update in 7 days.
- Awarded with no setup after 5 business days.
- Reporting with no owner.
Dashboard QA Checklist
Before sharing with leadership:
- Are request amounts current?
- Are awarded amounts separated from pending amounts?
- Are declined grants excluded from active totals?
- Are report dates visible?
- Are owners assigned?
- Are stages current?
- Are old opportunities archived?
Dashboards can mislead if data is stale. A clean dashboard is an operating tool; a stale dashboard is decoration.
Dashboard Views by Audience
Different users need different views.
Do not force everyone into the same dashboard. The source data should be shared, but the view should match the decision.
Pipeline Health Indicators
Healthy pipeline:
- Opportunities move stages regularly.
- Low-fit grants are declined before drafting.
- Drafting workload matches staff capacity.
- Reports are visible.
- Awarded grants have setup tasks.
- Leadership sees current totals.
Unhealthy pipeline:
- Many grants sit in Watch forever.
- Deadlines have no owners.
- All opportunities move to Drafting.
- Reports live outside the dashboard.
- Awarded grants disappear.
- Totals do not match finance expectations.
Example Dashboard Policy
"The grant pipeline dashboard is reviewed weekly by the grant team and monthly by leadership. Grant owners are responsible for updating stage, next action, deadline, and request amount. Awarded grants remain active until all reporting and closeout tasks are complete."
A short policy keeps the dashboard from becoming optional.
What the dashboard needs to answer
A useful dashboard answers simple questions quickly: what is active, what is due, who owns it, what is the request amount, and where is the bottleneck. If the dashboard cannot answer those questions without a meeting, it is not giving the team enough visibility.
Example Pipeline Report
This table gives leaders a concise view without requiring them to inspect every grant record.
Pipeline Governance
Set governance rules:
- Only active opportunities appear in active views.
- Declined opportunities require a reason.
- Awarded grants require report dates.
- Owners update next actions before weekly review.
- Finance confirms awarded amounts.
- Program staff confirm outcome commitments.
Governance keeps the dashboard from becoming a collection of guesses.
Pipeline Dashboard Template
Include these blocks:
This template gives the team a complete operating view without needing a separate report.
Example Dashboard Cleanup Routine
Once a month, archive declined opportunities, update pending decisions, confirm awarded amounts with finance, check report dates, and remove stale watch-list items. This cleanup keeps the dashboard useful and prevents leadership from making decisions from old data.
Example Stage Movement Rules
Move a grant to Drafting only after an apply decision is made. Move it to Internal Review only after the narrative and budget are ready. Move it to Submitted only after the confirmation receipt is saved. Move it to Awarded only after the award letter is received. Move it to Reporting only after report dates are entered. These simple rules make the dashboard more reliable.
They also make training easier because staff can learn the pipeline as a set of decisions, not as a vague set of labels. When stages are decision-based, bottlenecks can be traced to a real stage, owner, or missing decision, which makes the dashboard easier to audit and to explain to leadership.
FAQ
What is a grant pipeline?
A grant pipeline is a structured view of opportunities by stage, from research through post-award management.
What is a grant management dashboard?
It is a summary view of pipeline status, deadlines, funding amounts, owners, and reports.
How often should a grant pipeline be reviewed?
Most teams should review it weekly for active applications and monthly for leadership reporting.
Next Step
Build a pipeline that connects stages, owners, and dates. Then connect it to grant management software for nonprofits so reporting does not depend on manual spreadsheet cleanup.
Sources and Further Reading
Grants.gov — the central portal for finding and applying to federal grant opportunities.
USAspending.gov — the official open record of every federal award, searchable by recipient, agency, and program.