Grant Funding Snapshot October 2026: 2,979 Grant Listings
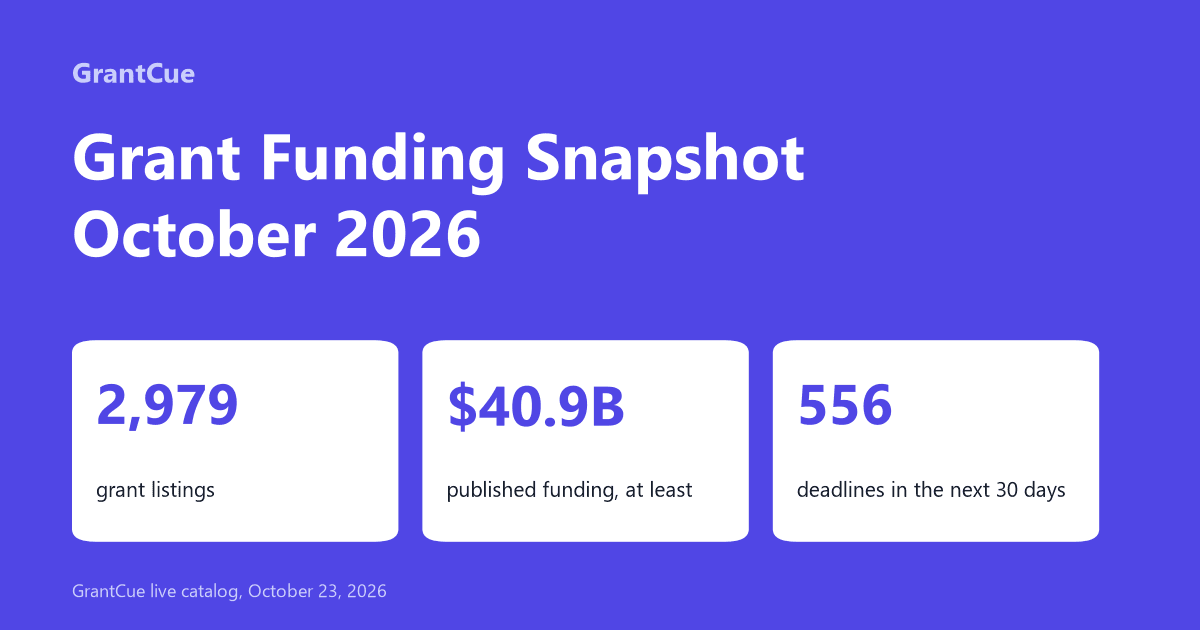
October 2026 grant data: 2,979 active federal, state and local opportunities, at least $40.9B in published funding and 556 deadlines in the next 30 days.
In this article (10)
As of October 23, 2026, GrantCue's catalog listed 2,979 active grant opportunities from Grants.gov, state and local grant portals, and the federal SBIR and STTR topic list. Of these, 566 are forecasts, which a funder announces before applications open; this post counts them among the open opportunities. The 920 listings that publish a funding estimate add up to at least $40.9 billion. Within 30 days, 556 of the opportunities close. The median award ceiling is $600,000.
State and local portals account for 1,329 of the open opportunities, up 64% from 808 in the August edition, mostly because the catalog now reads many more state and local sources. They list almost as many open opportunities as Grants.gov.
This is the third edition, after July 2026 and August 2026. No September 2026 edition was published; the series resumes with this one. The tables and figures may be republished with credit and a link to this page.
October 2026 at a Glance
Where the Listings and the Money Sit
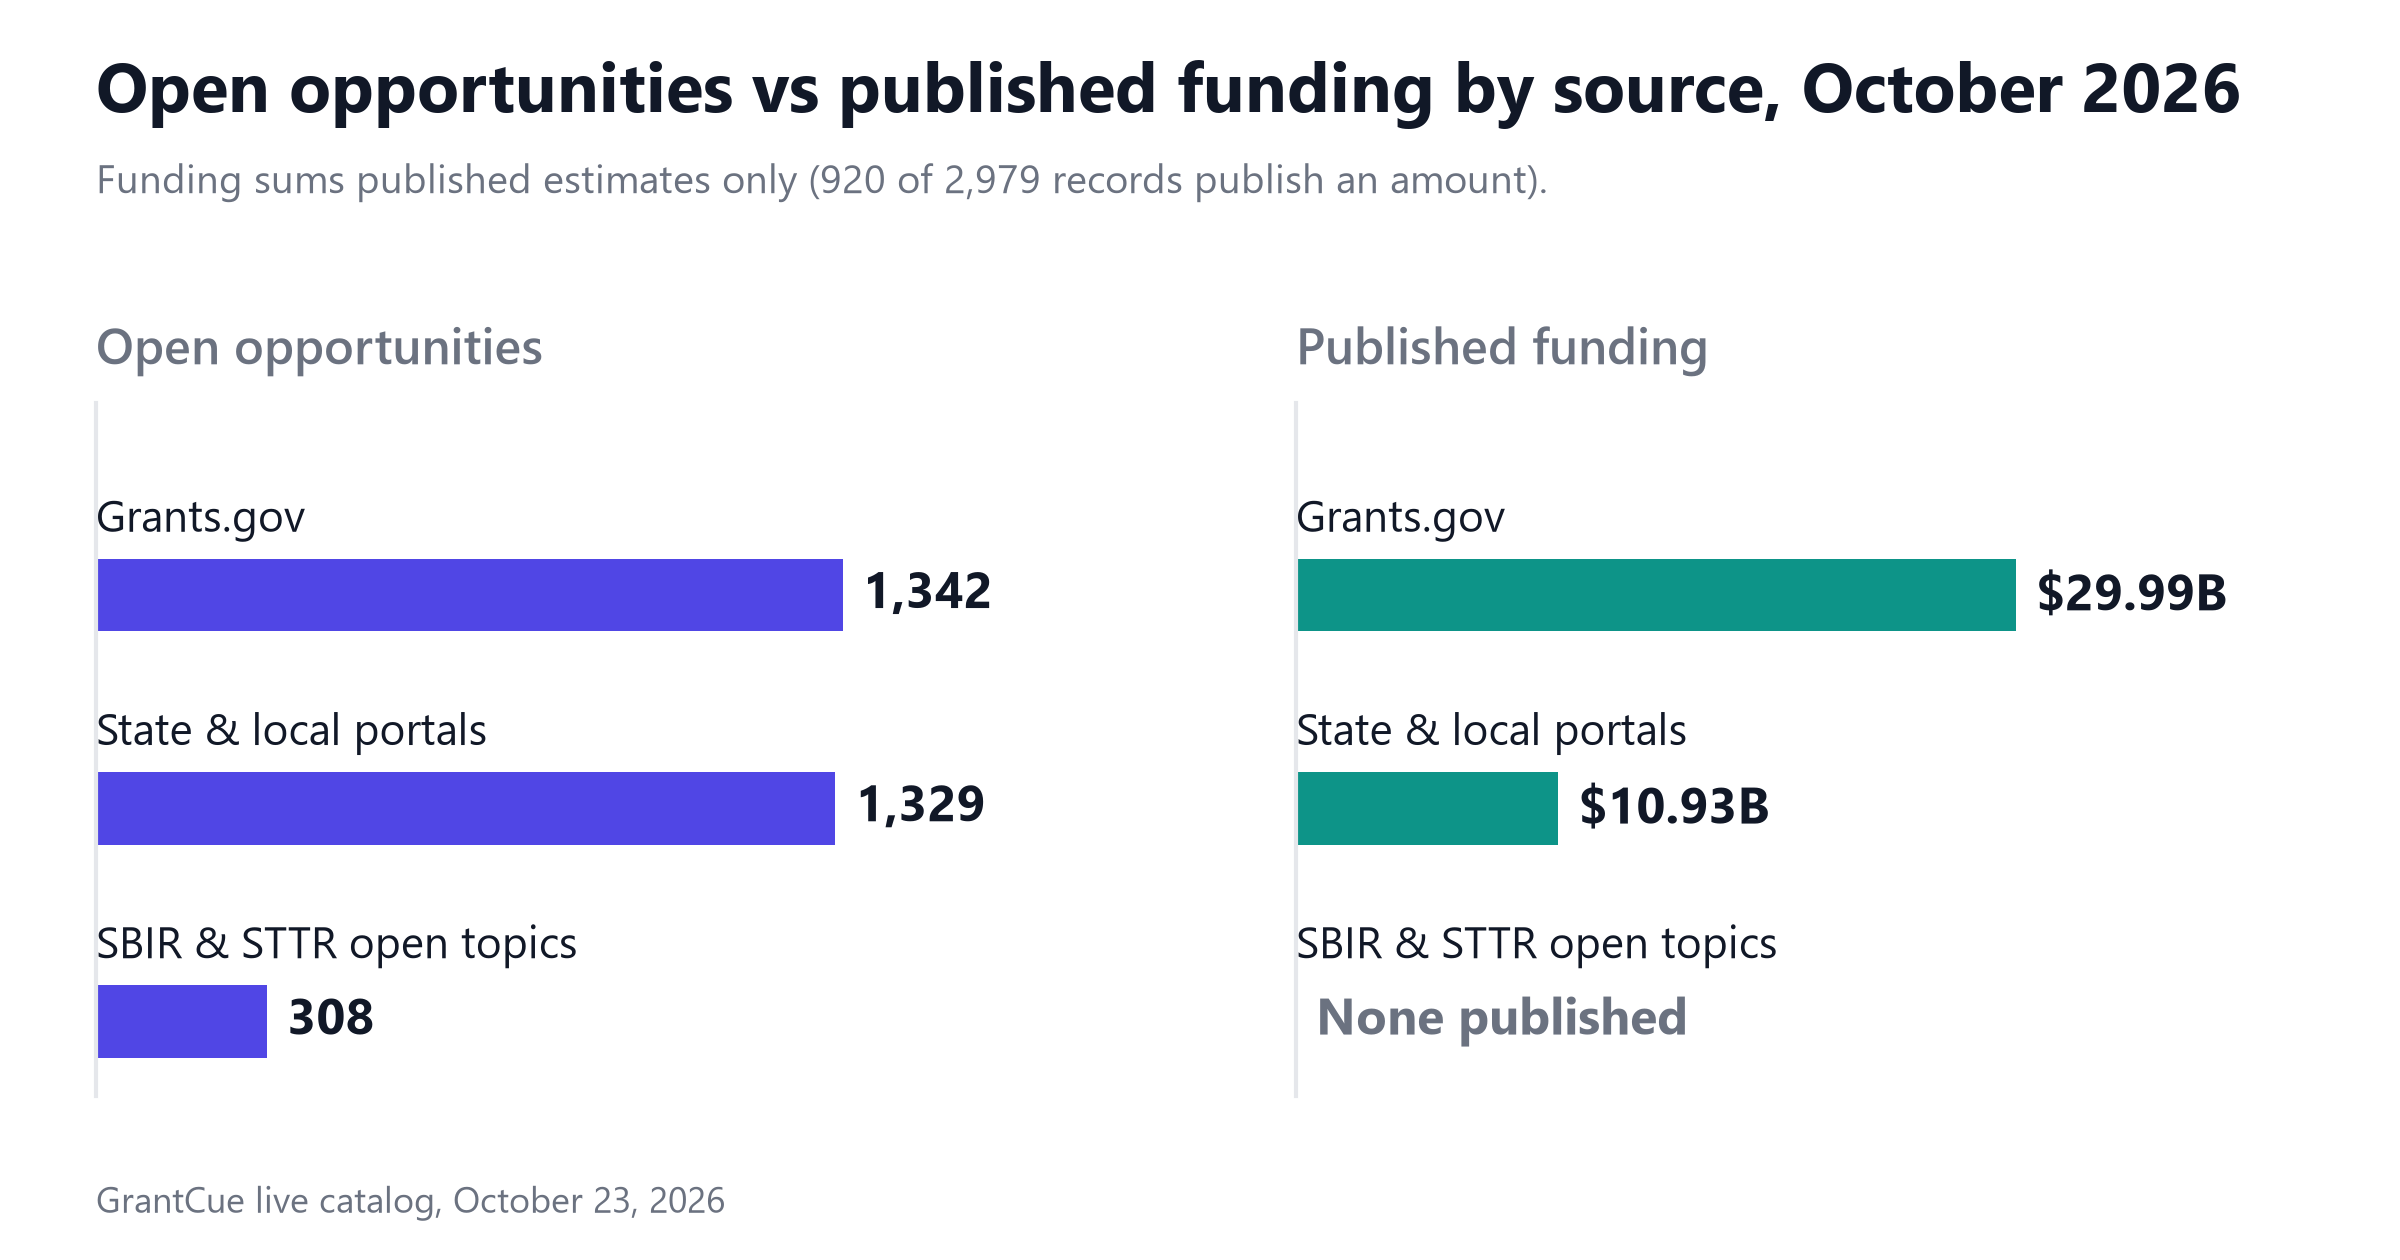
Grants.gov and the state and local portals list nearly the same number of open opportunities, but Grants.gov carries almost three quarters of the published dollars. Part of the reason is that more of its listings state an amount: 709 of 1,342 (52.8%) on Grants.gov, against 211 of 1,329 (15.9%) on state and local portals.
Why the Dollar Total Moved, and Why August's Was Too Low
The August edition reported $21.0 billion in published funding, with state and local portals ($11.5 billion) ahead of Grants.gov ($9.5 billion). Do not read the jump to $40.9 billion as growth in the money available. Until August 21, every refresh of GrantCue's Grants.gov list erased the fields that only a listing's detail page carries, among them the funding amount, the award ceiling, the eligibility list and the category. A backfill in October restored those fields for listings already in the catalog.
So the August dollar total was an undercount. The 1,012 Grants.gov listings that were already in the catalog on August 9 and are still open carry $17.87 billion today, nearly twice the $9.5 billion August printed for all of Grants.gov. The backfill is also a large part of why Grants.gov is now ahead of the state and local portals, and largely why the share of listings that publish an amount rose from 17% in August to 30.9% now. Because the two totals rest on different data, this edition compares counts and shares with August, never dollar totals.
Even now, every dollar figure is a floor: 2,059 of the 2,979 listings (69.1%) publish no amount. For federal notices the rules allow that: under 2 CFR 200.204(a)(6), an agency gives the expected total funding, number of awards and award sizes on Grants.gov "to the extent appropriate."
A few listings carry much of the total. The ten largest hold $12.95 billion, 31.6% of all published dollars. The largest single listing is the Employment and Training Administration's Fiscal Year 2027 State Workforce Agency Unemployment Insurance resources notice at $2.63 billion, posted September 30 and closing October 30.
Some state portal listings are federal programs, and some look like standing funds. Michigan's funding hub lists the U.S. Department of Agriculture's Rural Energy for America Program at $1.06 billion, and California lists its Charter School Facilities Program at $1.4 billion and its Children's Hospital Program at $775 million, both with no deadline. All three sit inside the $10.93 billion state and local figure, so that figure may double count some federal money and may overstate the money open to apply for.
What Changed Since August
Open opportunities rose 18.4%, from 2,517 to 2,979. The rise comes from the state and local portals and the SBIR and STTR topics, and much of it is wider coverage. On October 23, 142 state and local sources had open listings in the catalog, against 27 in the August pull, and the 308 SBIR and STTR topics come from a source added in September. Of the 659 listings first seen in the 30 days before this pull, 489 came from state and local sources. Grants.gov itself shows fewer open opportunities than August printed: 1,342 against 1,709.
The share of open opportunities closing within 30 days has hardly moved: 19.4% in July, 19.1% in August and 18.7% now. In every edition so far, about one open opportunity in five has been a month or less from its deadline.
The median award ceiling is $600,000, against $630,000 in August. The October backfill restored award ceilings too, and the median now rests on twice as many listings (885 against 444). Neither the median nor the share of ceilings at or below $500,000 compares like for like with August, so the small difference says little.
The August edition counted 308 opportunities closing in September. Counting by UTC date on today's data, 302 to 311 listings that were in the catalog on August 9 carried a September deadline, depending on whether listings their source later withdrew are counted, and 277 first seen after the August pull did too. None of them is still open. Between August 10 and October 23, 1,374 opportunities closed on their deadline.
Closing Soon: Deadlines Through November 22
By October 30, 121 opportunities close: 85 on state and local portals and 36 on Grants.gov. Another 10 state and local listings were due on October 23 itself. Within 30 days, through November 22, 556 close: 331 on state and local portals, 221 on Grants.gov and 4 SBIR and STTR topics. That is 25.5% of the 2,181 listings with a future deadline.
October 30 is the busiest single day in the coming month, with 63 deadlines: 17 on Grants.gov and 46 on state and local portals, led by North Carolina's Department of Health and Human Services (4) and the California state portal (4). The $2.63 billion unemployment insurance notice closes that day. The next busiest days are November 13 (45 deadlines), November 16 (38), November 2 (36) and November 6 (33).
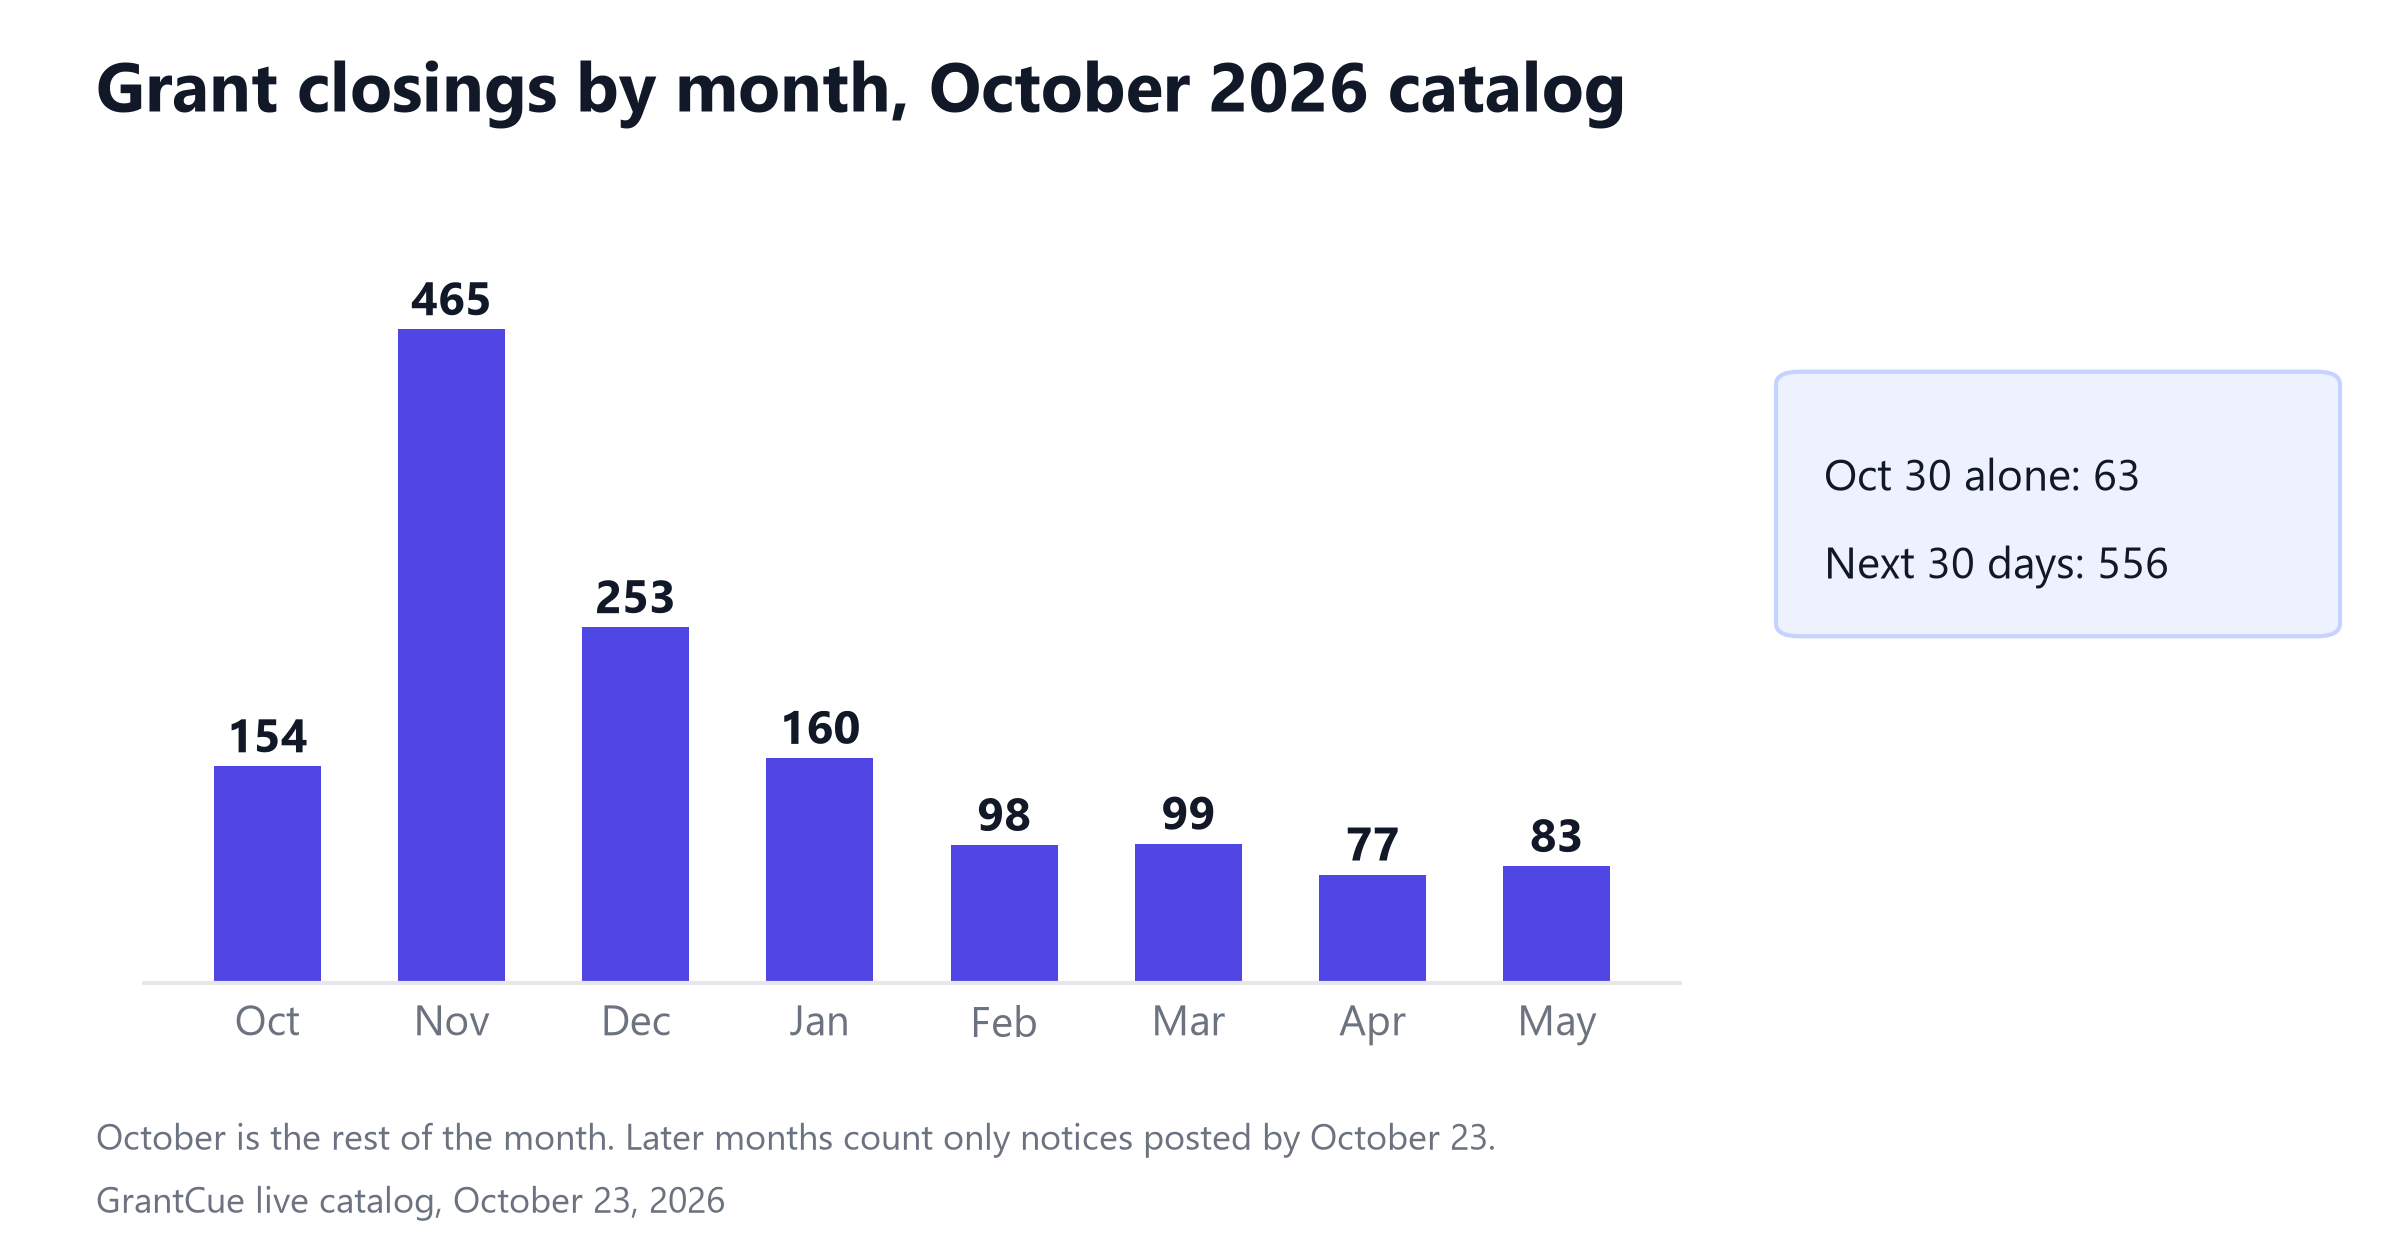
The later months count only notices posted by October 23, which is one reason they look thinner than the near months.
SBIR and STTR Open Topics
308 of the open opportunities are small business research topics from SBIR.gov's open-topic list, a source GrantCue added after the August edition; its topics were first seen between September 8 and October 7. The National Science Foundation lists 268 of them, the Department of War 25 (the name the list uses for the Department of Defense), the Department of Health and Human Services 11 and the Environmental Protection Agency 4.
Their deadlines run from November 8, 2026 to September 30, 2027. Only 4 close within 30 days and none within 7, so the topics barely touch the near-term figures.
The topic list publishes no award amounts, so the topics count in every opportunity figure in this post and add nothing to any dollar total. Each agency's solicitation sets its award sizes. The topics are new coverage, not new funding.
All 308 topics name small businesses as eligible. Counting them, 1,038 open opportunities name small businesses: the 308 topics and 730 other listings, 717 of them on Grants.gov. The National Science Foundation appears under two names in the catalog, "National Science Foundation" on its 268 topics and "U.S. National Science Foundation" on 121 Grants.gov listings, 389 in all. GrantCue's guide to SBIR and STTR grant management covers the registrations and agency deadlines behind these topics.
Who Funds, and Who Can Apply
The National Institutes of Health lists 655 open opportunities, 22.0% of all the opportunities in this snapshot and 48.8% of the Grants.gov listings. The next Grants.gov funders by count are the National Science Foundation (121), the Centers for Disease Control and Prevention (52), the Health Resources and Services Administration (48), the Defense Health Agency's contracting activity (28), the Administration for Community Living (25) and the Bureau of Justice Assistance (23). On state and local portals, the largest funders by count are Illinois's Department of Natural Resources (61), Pennsylvania's Department of Community and Economic Development (54) and the Texas Education Agency (31).
Grants.gov uses a fixed list of applicant types, and a listing usually names several, so the rows below overlap, and the table shows a selection of the types. 1,335 of the 1,342 Grants.gov listings carry eligibility data.
About six in ten Grants.gov listings name 501(c)(3) nonprofits (803 of 1,342), and about as many name public universities or state governments. 992 listings also name "Others" and explain who qualifies in the notice text, so read the notice before ruling a listing out. State and local portals each describe eligibility in their own words, and only 649 of their 1,329 listings carry any, so they are not in the table.
State and Local Portals
The 142 state and local sources with open listings break down into 103 state sources (1,239 listings), 36 local sources (72) and 3 others (18). The largest by open opportunities:
Counts are per source, and some states have more than one. California's Office of Emergency Services list, for example, is counted separately from the state portal.
Award Ceilings: A $600,000 Median
An award ceiling is the most a funder says it will give one recipient. 885 open opportunities publish one, and their median is $600,000: $750,000 across 583 Grants.gov listings and $283,419 across 302 state and local listings. 428 of the 885 (48.4%) are at or below $500,000.
By band, 135 ceilings are under $100,000, 230 run from $100,000 to under $500,000, 209 from $500,000 to $1 million, and 311 are over $1 million. 63 listings sit at exactly $500,000; they count in the $500,000 to $1 million band and in the at-or-below-$500,000 figure.
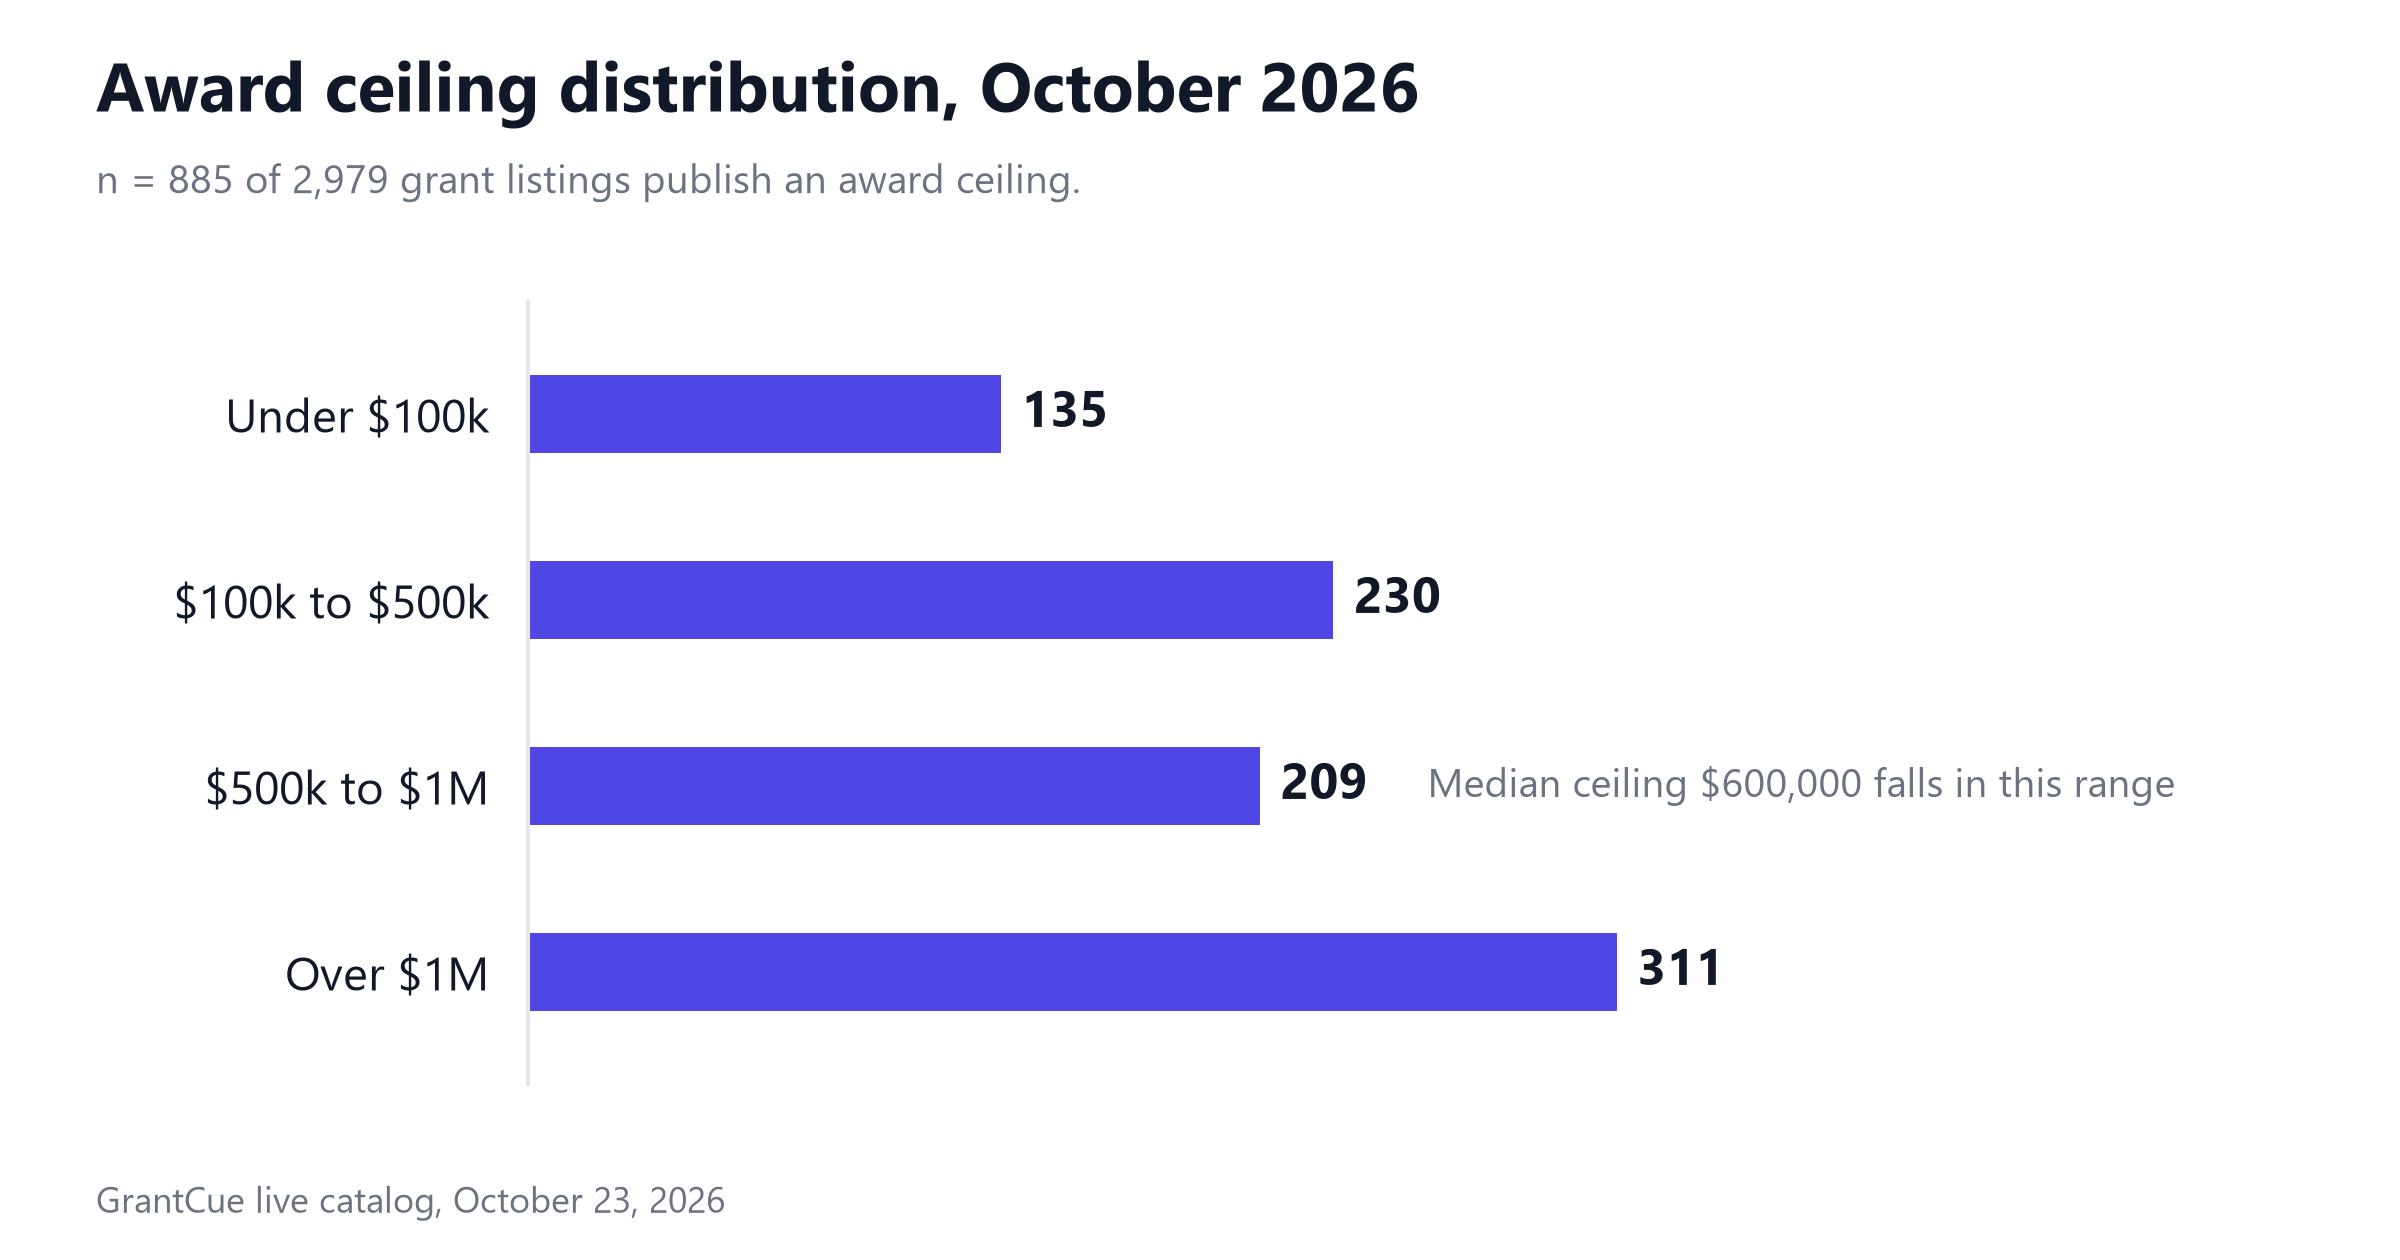
This post gives medians rather than averages, because large ceilings pull the average far above the median. Five ceilings are $250 million or more, among them $1.3 billion on one Grants.gov listing and $999,999,999 on another (a value that looks like a placeholder).
Methodology
- The figures come from read-only queries against GrantCue's production grant catalog on October 23, 2026, at 15:41 UTC. The queries ran twice and returned identical results.
- The count covers active listings of the opportunity type from Grants.gov, SBIR.gov's open-topic list, and 142 state and local sources with active listings. Posted and forecasted listings both count (2,413 and 566). Whether the August count included forecasted listings is not known.
- Foundation and corporate giving are left out, and so are standing programs that take applications without a deadline (1,252 were active).
- Dollars are the sum of published estimated funding. Listings with no amount add nothing, so every dollar figure is a floor. One Grants.gov listing, Advancing Global Health, shows exactly $2,147,483,647, the largest value a signed 32-bit integer can hold. That is an overflow value in the source feed, not a real award, so it is left out of every dollar figure; its $250 million award ceiling stays in the ceiling figures.
- Award ceilings are reported as medians, because a few very large or placeholder ceilings distort the average.
- Deadline windows count from the moment of the pull, the same way as in July and August. For a forecasted listing, the deadline is the due date the funder estimates. A deadline published as a date is stored at midnight UTC, and deadline months and days are counted by UTC date. That is why 10 state and local listings due on October 23 were still open at the pull; they sit outside both the future-deadline and the no-deadline counts.
- August figures are as printed. The August query was not saved, so this edition's definition was applied to the catalog's history. It finds 804 state and local opportunities open on August 9 (August printed 808) and between 1,526 and 1,870 on Grants.gov (August printed 1,709), depending on whether listings their source later withdrew are counted. The definitions are comparable, not identical.
- A backfill in October restored Grants.gov amounts, award ceilings, eligibility, categories and cost sharing flags, so dollar totals and the category, eligibility and cost sharing counts are not compared with August, and the award ceiling comparison is not like for like.
- Some state portals list federal programs or standing funds, so the state and local dollar figure may double count some federal money and may overstate what is open to apply for.
- The methodology page explains how every snapshot is built and how to cite one.
- This describes what GrantCue tracks, not every grant in the United States.
Cite as: GrantCue, Grant Funding Snapshot, October 2026. https://www.grantcue.com/blog/grant-funding-snapshot-october-2026
FAQ
How much grant money is open right now?
GrantCue's catalog listed 2,979 open grant opportunities on October 23, 2026, and the 920 that publish a funding estimate add up to at least $40.9 billion. That total is a floor: 2,059 of the listings (69.1%) publish no amount and add nothing to it. Some state portal listings are federal programs or standing funds, though, so the total may double count some federal money and overstate what is open to apply for. The 2,979 include 566 forecasts, which a funder announces before applications open.
Has open grant funding nearly doubled since August?
Do not read the jump from $21.0 billion to $40.9 billion as growth in the money available. August's total was an undercount: until August 21, every refresh of GrantCue's Grants.gov list erased the funding amount and other fields that only a listing's detail page carries, and a backfill in October restored them. The 1,012 Grants.gov listings that were in the catalog on August 9 and are still open carry $17.87 billion today, nearly twice the $9.5 billion August printed for all of Grants.gov. Because the two totals rest on different data, this edition compares counts and shares with August, never dollar totals.
How many open grants are on state and local portals?
State and local portals list 1,329 open opportunities, almost as many as Grants.gov's 1,342 and 64% more than the 808 in the August edition. Most of the rise is wider coverage: 142 state and local sources had open listings on October 23, against 27 in the August pull. The 211 state and local listings that publish an amount carry $10.93 billion. Some state portal listings are federal programs or standing funds, so that figure may double count some federal money and overstate what is open to apply for.
What is the typical grant award size?
This snapshot measures award ceilings, the most a funder says it will give one recipient. Across the 885 open opportunities that publish one, the median ceiling is $600,000: $750,000 on Grants.gov and $283,419 on state and local portals. Of the 885, 428 (48.4%) are at or below $500,000. This edition reports medians, not averages, because a few very large ceilings pull the average far above the median: one Grants.gov listing has a $1.3 billion ceiling, and another shows $999,999,999, a value that looks like a placeholder.
How many grants close in the next 30 days?
Within 30 days of the October 23 pull, through November 22, 556 open opportunities close: 331 on state and local portals, 221 on Grants.gov and 4 SBIR and STTR topics. That is 18.7% of everything open, close to July's 19.4% and August's 19.1%. October 30 is the busiest single day in the coming month, with 63 deadlines.
Are SBIR and STTR topics counted in these figures?
Yes. The 308 open topics from SBIR.gov's open-topic list, a source GrantCue added after the August edition, count in every opportunity figure in this snapshot. The list publishes no award amounts, so the topics add nothing to any dollar total; each agency's solicitation sets its award sizes. The National Science Foundation lists 268 of them, and only 4 close within 30 days.
GrantCue's free foundation directory covers the private foundations this snapshot leaves out. The catalog behind these figures is searchable in GrantCue with a free account.