U.S. Grant Funding Snapshot: July 2026 — $10.8B Open and 1 in 5 Deadlines Within 30 Days
Original data from GrantCue's live catalog: $10.8 billion in open grant funding, 518 deadlines within 30 days, and the agencies and states behind the numbers.

In this article (8)
As of July 16, 2026, GrantCue's live catalog is tracking **2,670 active grant
opportunities worth an estimated $10.8 billion**, aggregated daily from Grants.gov and
14+ official state grant portals. This snapshot breaks down where that money is, who is
offering it, and how quickly the application windows are closing.
Every chart on this page may be republished with credit and a link back to this report.
Next edition: the August 2026 grant funding snapshot is live, with state portals overtaking Grants.gov in tracked dollars.
Quick Answer: How Much Grant Funding Is Open in July 2026?
- $10.8 billion in estimated funding is open across tracked federal and state sources ($10,835,087,966).
- 2,670 opportunities are active; 1,505 have published future deadlines.
- 518 opportunities — nearly 1 in 5 — close within the next 30 days.
- The median maximum award is $500,000; the average ($4.57M) is skewed by a few federal mega-programs.
- The National Institutes of Health posts 27% of all open opportunities on its own.
The 30-Day Crunch
Of everything open right now, 518 opportunities (19.4%) close by mid-August. Extend the
window and the pressure grows: 703 close within 60 days and 850 within 90.
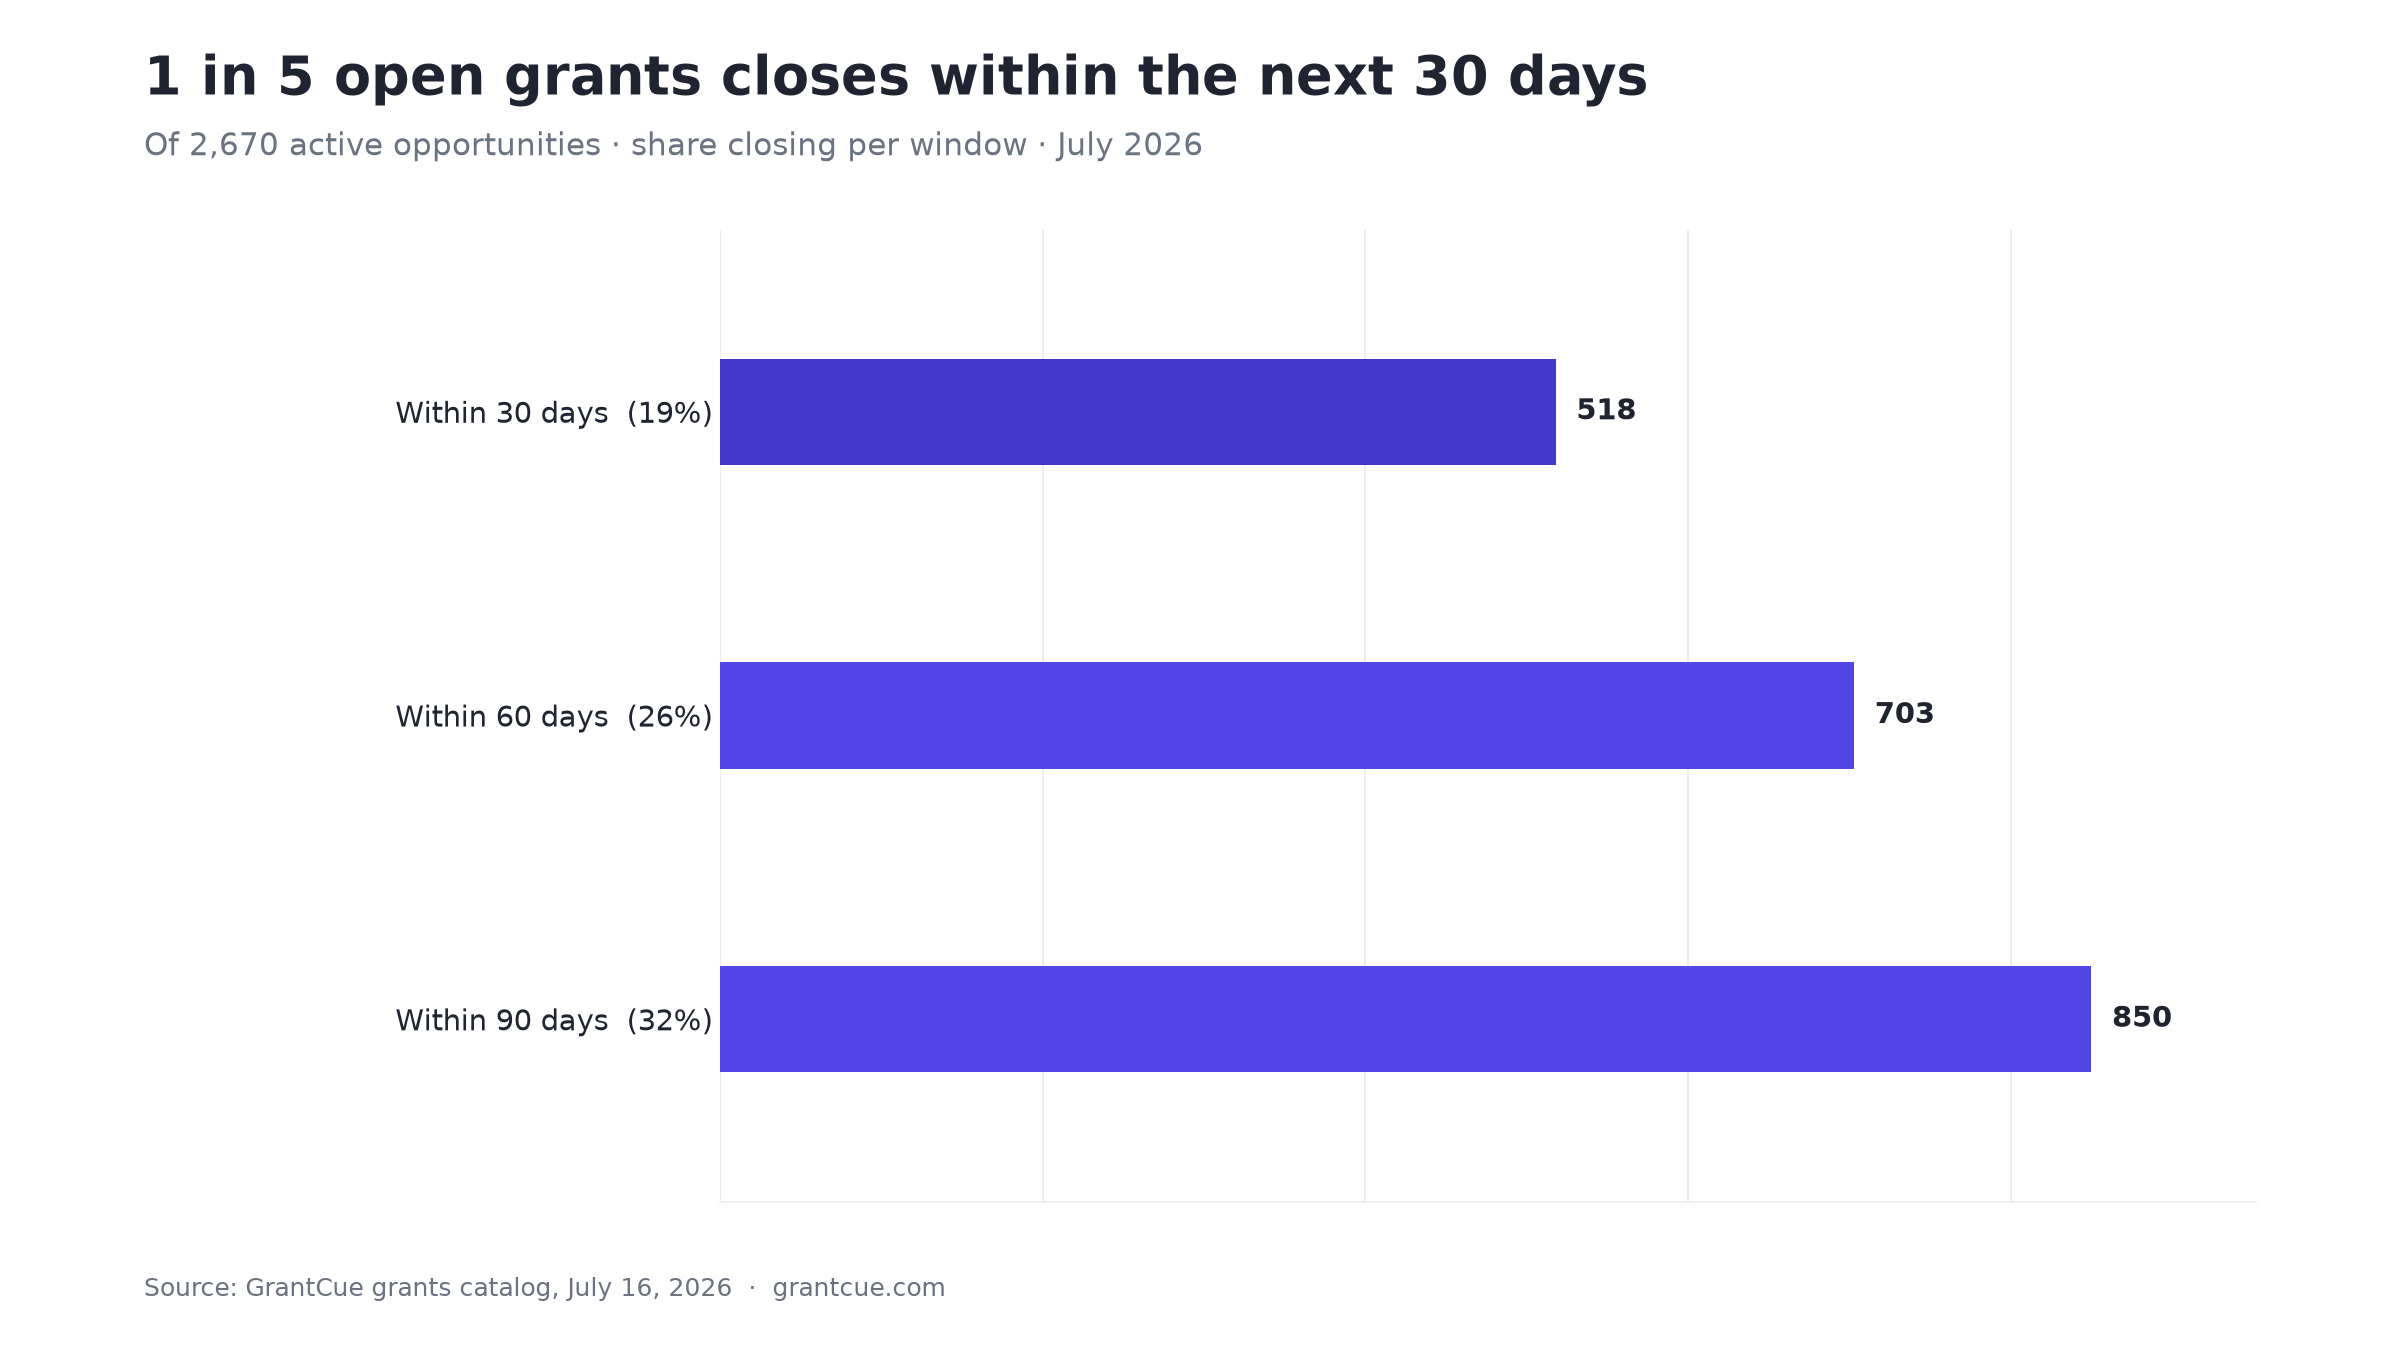
The practical takeaway: organizations that slow their grant search over the summer are
forfeiting nearly a fifth of the live market. If your team plans applications in
quarterly cycles, July is not a quiet month — it is a deadline cluster. A
deadline-tracking workflow matters most in
exactly these windows.
The Award-Size Illusion
Headlines about grant funding tend to feature eight-figure programs. The live data tells
a more encouraging story for small and mid-sized organizations:
- Median maximum award: $500,000
- Average maximum award: $4,566,843
When the average is nine times the median, a handful of giant programs are distorting
the picture. Most open grants are mid-six-figure opportunities — winnable for a typical
nonprofit, research team, or small business, not moonshots reserved for national
institutions.
Who Is Funding: The Agency League Table
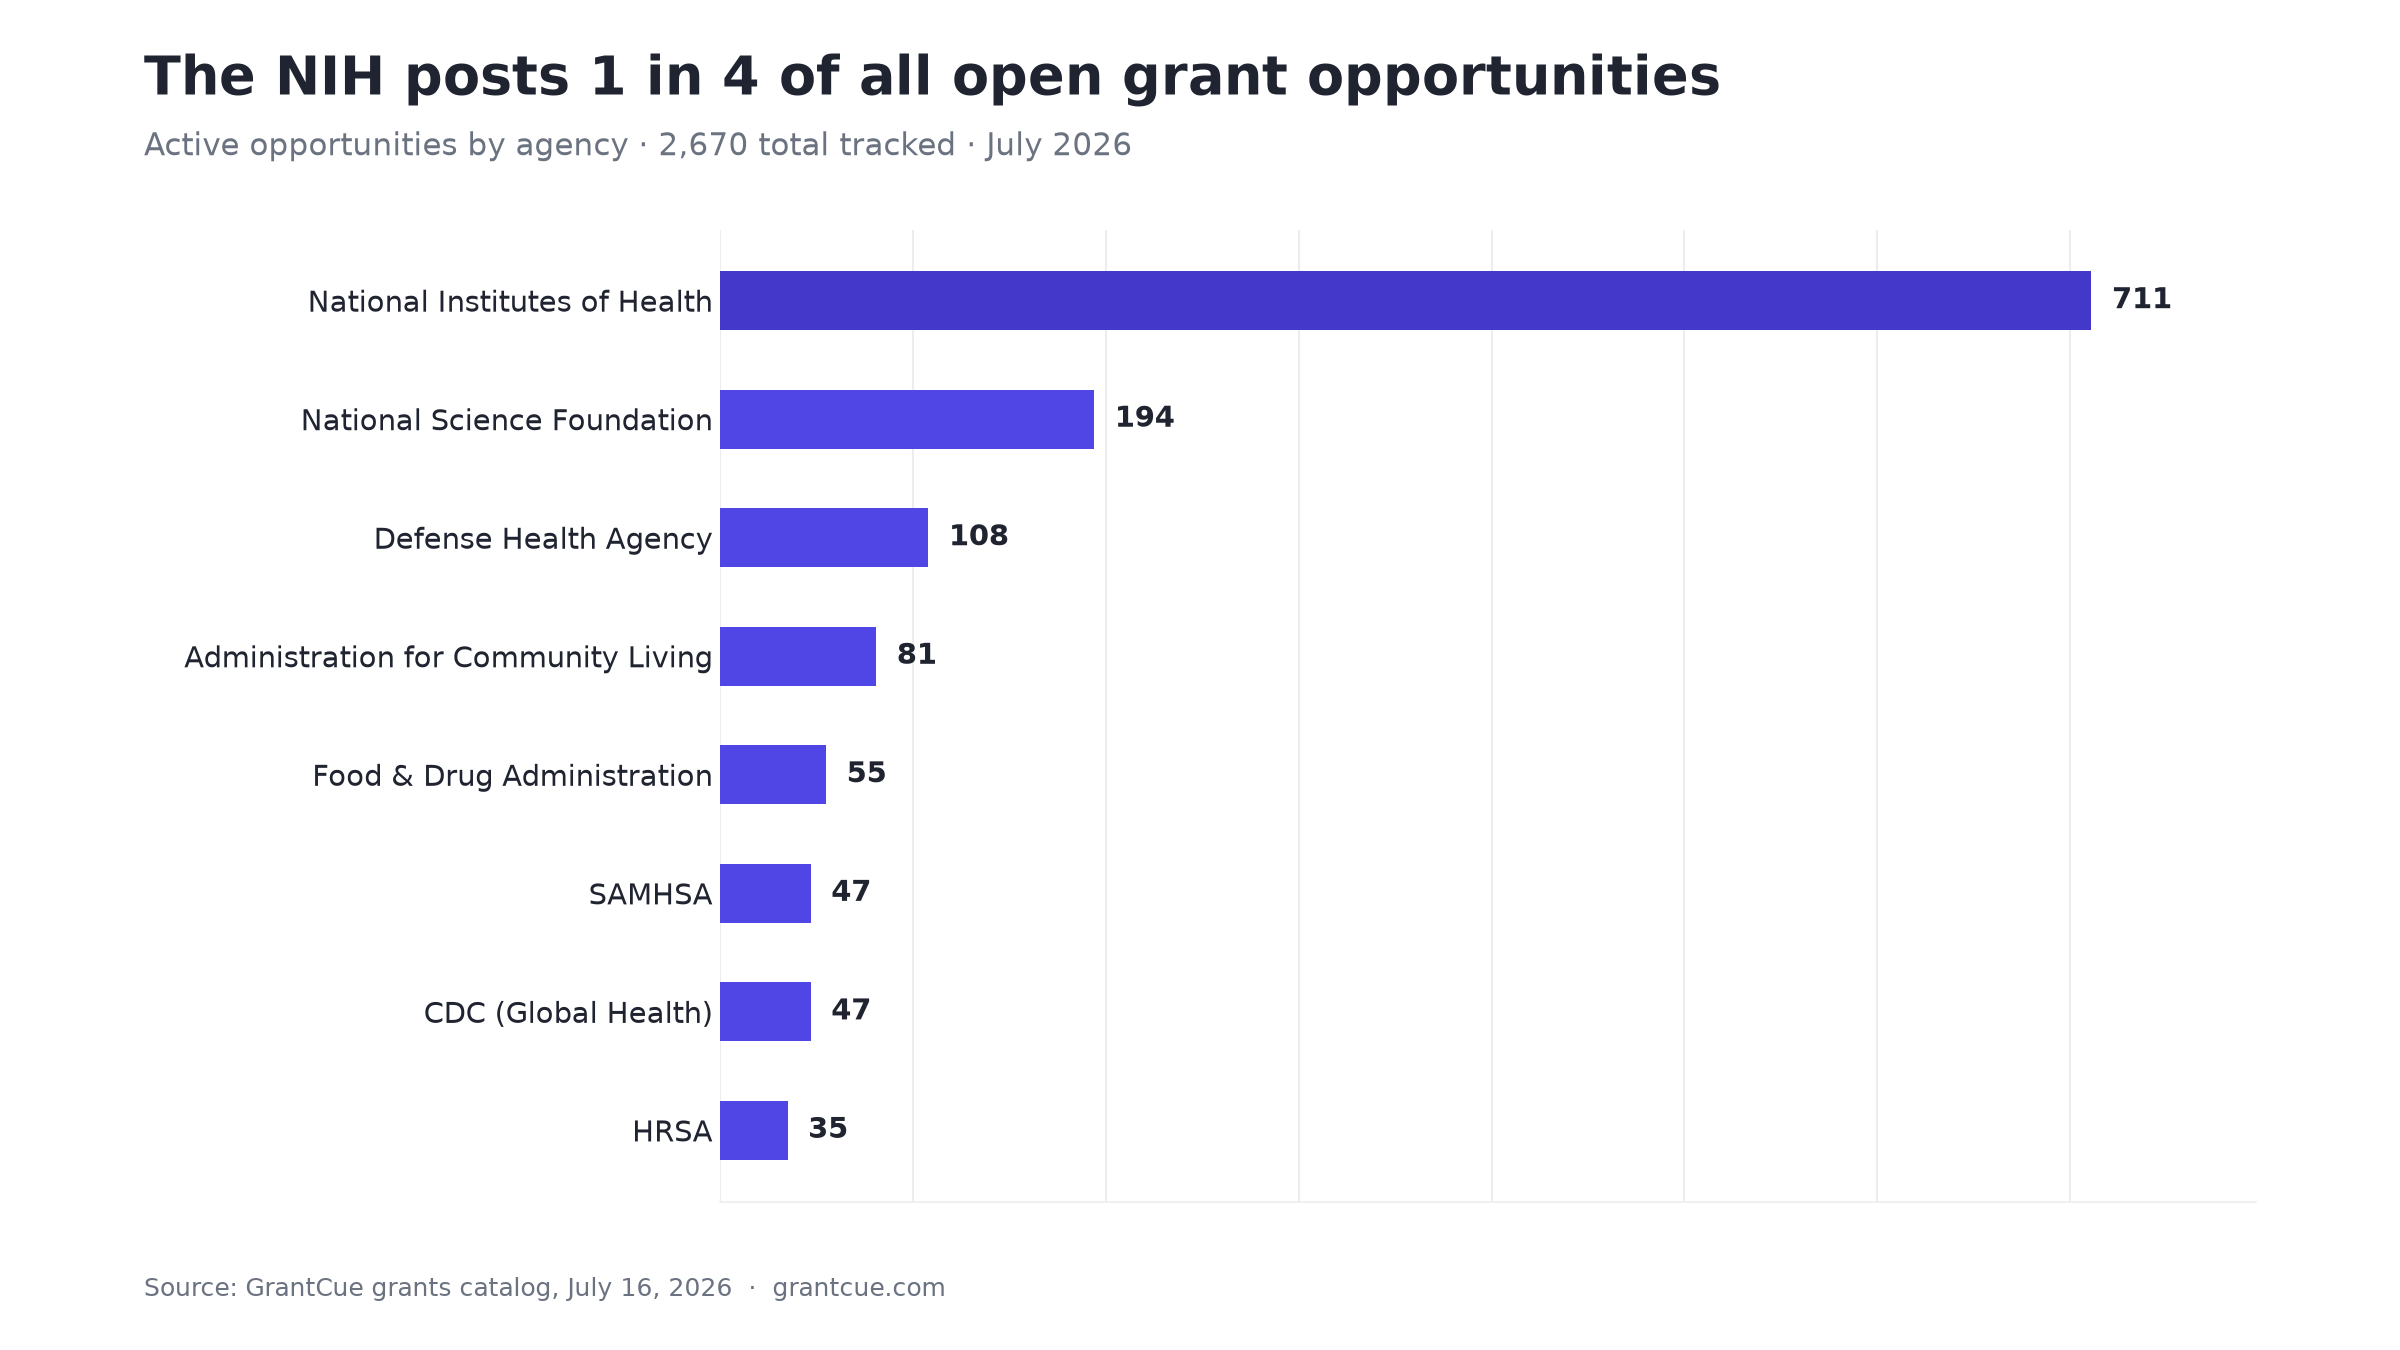
Two things stand out. First, the NIH's 711 open opportunities are more than the next
four agencies combined — 27% of the entire open market. Second, health dominates
broadly: eight of the top twelve agencies by open opportunities are health-related. If
your mission touches health, behavioral health, or community wellbeing, the current
market is unusually deep.
The State Layer Most Organizations Never Check
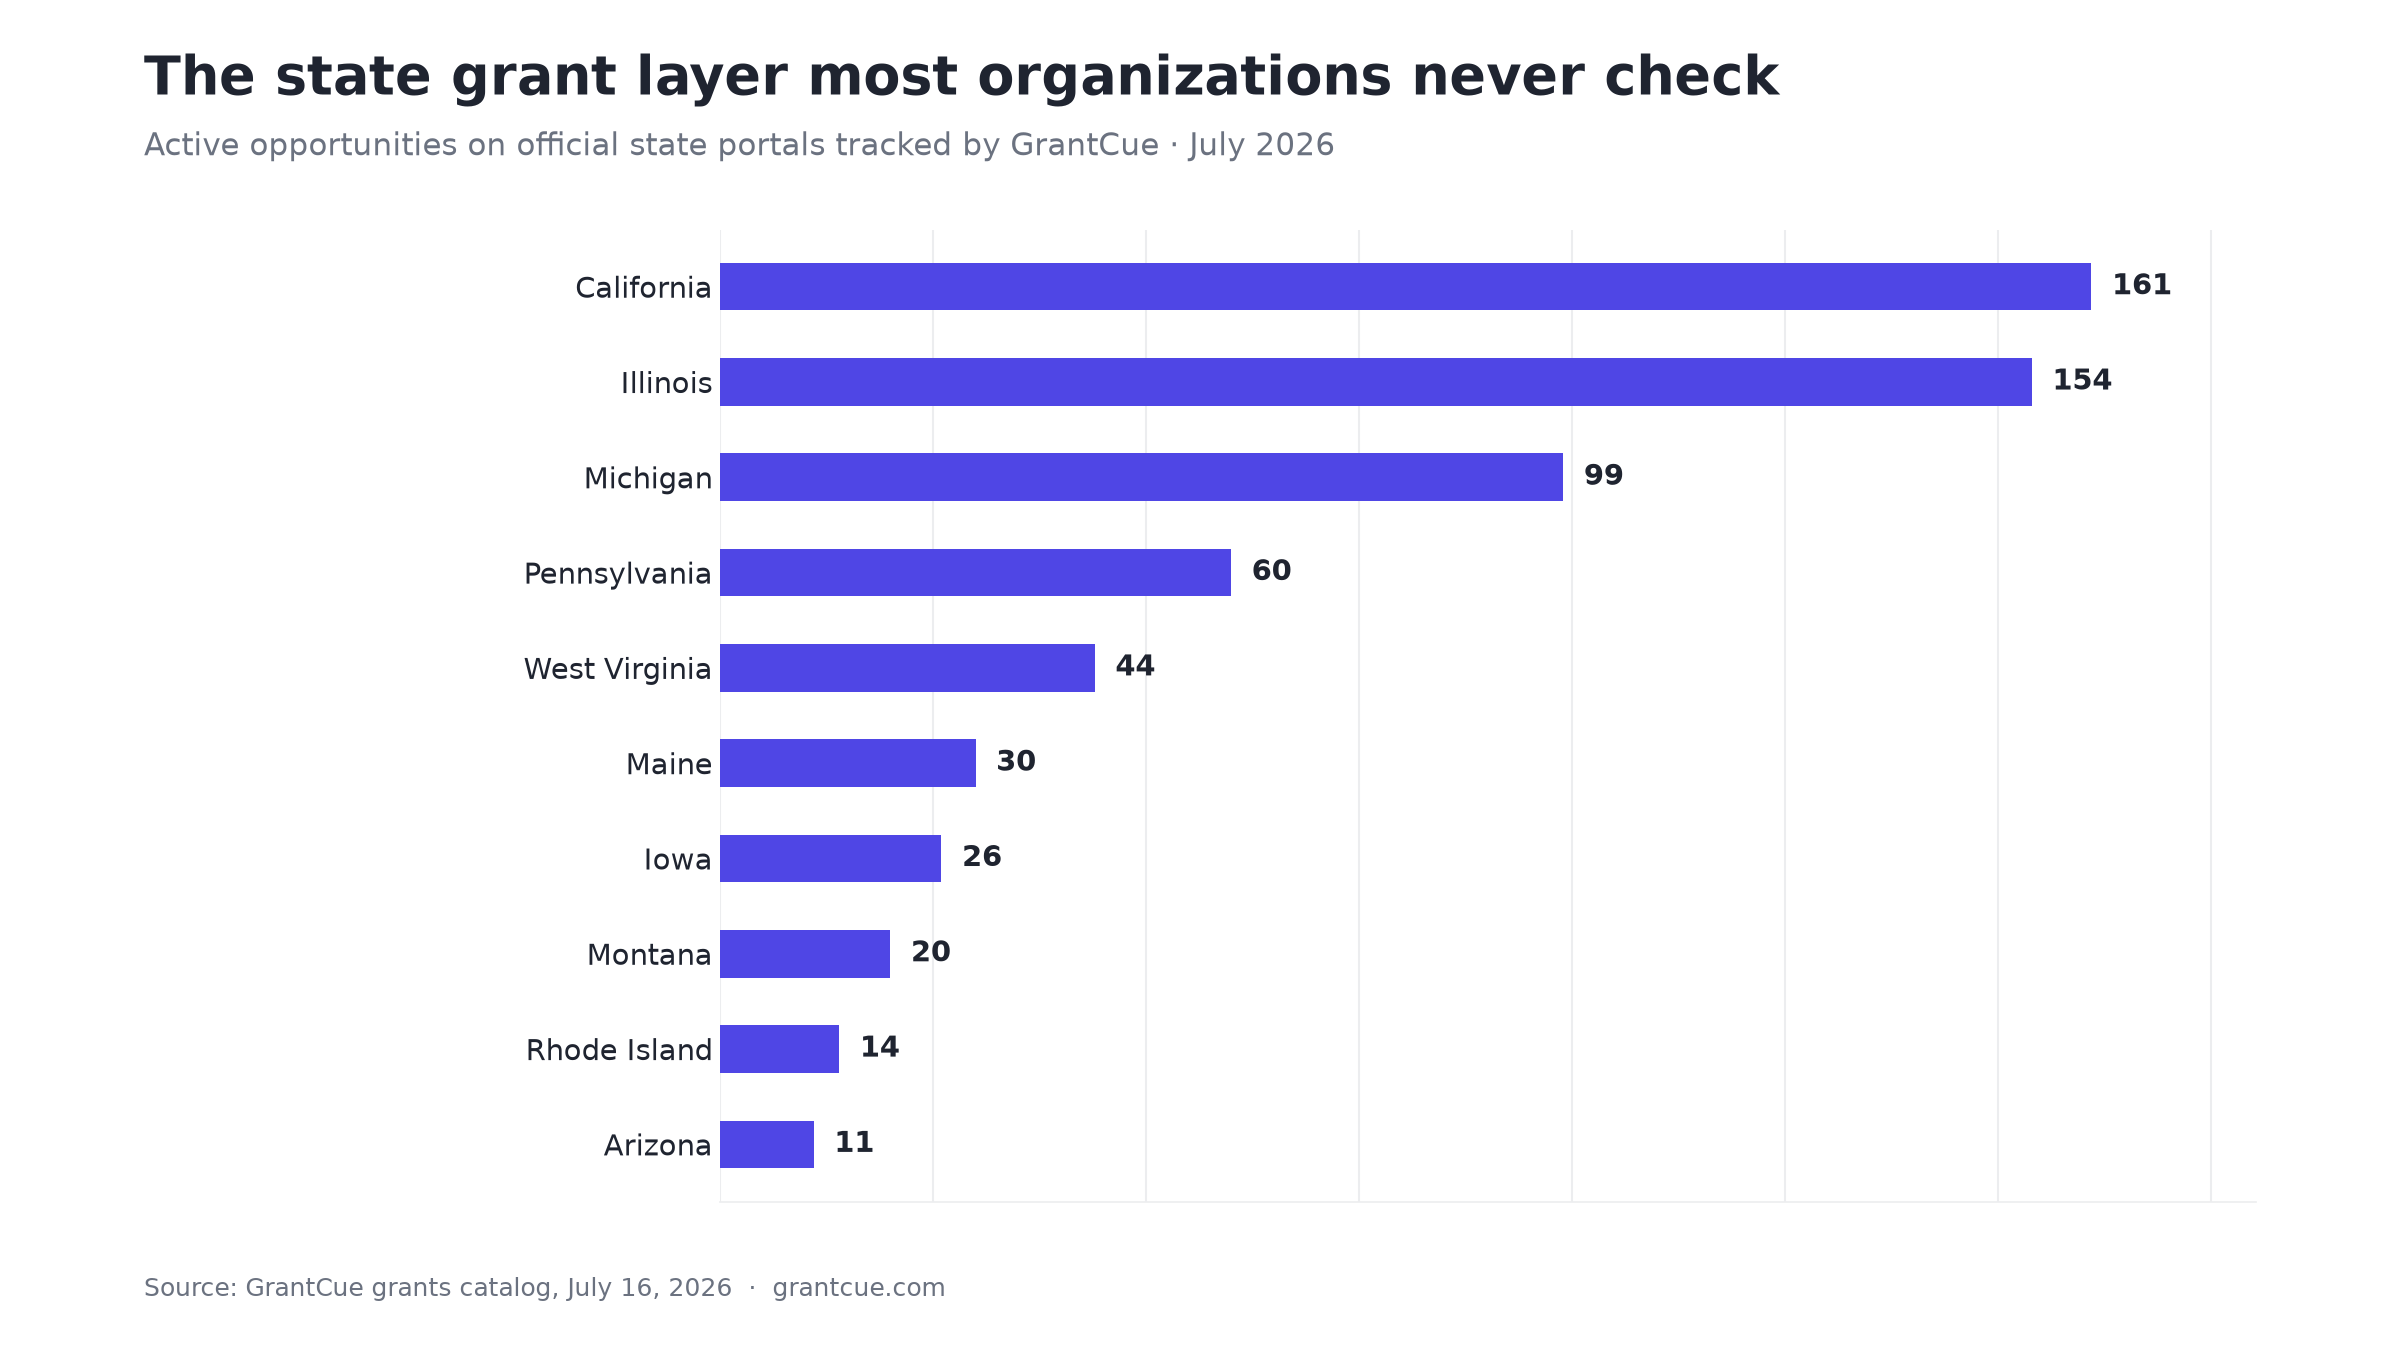
Beyond Grants.gov, official state portals are carrying hundreds of live opportunities:
California (161), Illinois (154), Michigan (99), Pennsylvania (60), West Virginia (44),
Maine (30), Iowa (26), Montana (20), Rhode Island (14), and Arizona (11), among others.
The reason these get missed is structural: every state runs different software — eCivis
in Rhode Island and Arizona, WebGrants in Iowa, GATA in Illinois, SharePoint in West
Virginia. There is no single place to search them, so multi-state and local
organizations routinely overlook money they are eligible for. (Aggregating these portals
into one searchable catalog is a large part of why GrantCue exists.)
Top Funding Categories
Where sources publish a category, the leaders are Environment & Water (61), Health &
Human Services (56), Community & Economic Development (66 across two labels),
Disadvantaged Communities (41), Agriculture (21), and Education (16).
An honest caveat: roughly 86% of opportunity records carry no normalized category at
all. Funders are inconsistent about classification — which is exactly why we run AI
enrichment on every opportunity in the catalog.
Methodology
Figures reflect active grant opportunities in GrantCue's catalog as of July 16, 2026,
aggregated daily from Grants.gov and 14+ official state grant portals. "Open funding"
sums each opportunity's estimated total program funding where the source publishes it;
opportunities without published amounts are excluded from dollar totals, so the $10.8B
figure is a floor, not a census. This report describes what GrantCue tracks, not every
grant in America.
Charts and statistics may be republished with credit and a link to this page.
FAQ
How much grant money is available right now?
Across the federal and state sources GrantCue tracks, an estimated $10.8 billion in
funding is open as of July 16, 2026, spread across 2,670 active opportunities.
What is the typical grant award size?
The median maximum award among currently open opportunities is $500,000. Averages look
much higher (about $4.6M) because a small number of federal mega-programs skew the mean.
Which federal agency offers the most grants?
The National Institutes of Health, with 711 open opportunities in July 2026 — about 27%
of everything active. The National Science Foundation is second with 194.
Do state grant portals list different grants than Grants.gov?
Yes. State portals list hundreds of opportunities that never appear on Grants.gov —
over 600 active state-portal opportunities are in GrantCue's catalog right now, led by
California, Illinois, and Michigan.
How often is this data updated?
GrantCue syncs its sources daily. This snapshot is published monthly; the underlying
numbers are visible live in the grant catalog.
The August 2026 edition is the latest.
---
*Every number in this report comes from the same live catalog GrantCue users search.