Grant Tracker Dashboard Template, With an SBIR Grant Dashboard Variant
A grant tracker dashboard template with the pipeline, award and reporting numbers worth watching, the Excel formula behind each one, and the two columns that turn it into an SBIR grant dashboard.

In this article (10)
- Quick Answer: What Should a Grant Tracker Dashboard Show?
- What a Grant Tracker Dashboard Template Shows
- The Data Tabs Behind the Dashboard
- Dashboard Formulas: COUNTIFS, SUMIFS and MINIFS
- A Worked Example: One Quarter-End Snapshot
- Keeping the Dashboard Current
- Adapting the Template Into an SBIR Grant Dashboard
- Where a Spreadsheet Dashboard Stops Coping
- FAQ
- Load Last Quarter's Rows, Then Read the Dashboard
A grant tracker dashboard template turns the rows in your tracker into a few numbers a director can read in a minute: what is pending, what is due, what is late. Every figure on it is a formula over the data tabs, so the dashboard is only as current as the rows underneath it.
Charts are the easy part. The work is in choosing numbers that each lead to an action, and in keeping the rows they read up to date. With two added columns, the same workbook becomes an SBIR grant dashboard for a startup tracking SBIR and STTR submissions and awards.
Quick Answer: What Should a Grant Tracker Dashboard Show?
A grant tracker dashboard should show 13 numbers in three blocks, each a formula over the data tabs: pipeline (open applications, dollars pending, applications due soon, two win rates, days to decision), awards (active awards, their value, awards ending soon) and reports (due soon, overdue, on-time rate, next due date). An SBIR grant dashboard adds agency and SBIR/STTR columns.
Free download: Dashboard workbook with live formulas (13 metrics, a stage summary and three data checks) as Excel .xlsx. No email address required.
Tracking these dates? GrantCue reminds you before each deadline and report you add. Track deadlines free
What a Grant Tracker Dashboard Template Shows
A grant tracker dashboard template shows one number per management question, grouped by where each grant sits: in the pipeline, under award, or owing a report. A number that nobody would act on does not belong on it.
Two kinds of number stay off this page on purpose. Spending against budget needs its own comparison, line by line, for each award; federal rules require "Comparison of expenditures with budget amounts for each Federal award" (2 CFR 200.302(b)(5), eCFR, current as of September 2026), and a budget-versus-actual workbook does that job. Program outcomes, the numbers a funder asks you to report, are a different set again, covered in the grant metrics and KPIs guide.
Each metric also has a natural owner. The pipeline block belongs to whoever runs development or grant writing, the awards block to the program or grants manager, and the reports block to whoever signs reports. Put the owner's role next to each block on the dashboard, so a red number has an owner beside it. The three blocks follow the stages a grant passes through, which the grants lifecycle management guide sets out from discovery to closeout.
The download adds a stage summary under the three blocks: a count and the total amount requested for each of the six stages, which is the table a pipeline chart draws from. Below that sit three data checks that count rows with missing or stale information.
The Data Tabs Behind the Dashboard
The dashboard reads three data tabs. The applications tab holds one row per application with its stage, dates and amounts, next to an awards tab and a reports tab built the same way. The dashboard tab holds only formulas and a few settings cells, and every row a person types lives on a data tab.
Three commenters in one Reddit thread arrived at the same split: one suggested a master tab that compiles data from the other tabs, a second replied "call that tab Dashboard," and a third described a summary tab pulled from each grant tab (Reddit thread 1qx3lpf, read September 2026). The download keeps each kind of record on one tab instead of one tab per grant, so adding a grant means adding a row, and no formula has to change. The other layout has its own guide, a grant tracker with one tab per grant.
The stage list on the applications tab is fixed: Prospect, Writing, Submitted, Awarded, Declined and Withdrawn. The dashboard counts by those exact words, so a stage typed as Submitted (waiting) drops out of every total. A drop-down list on the Stage column prevents that.
Once an application is awarded, its row stays on the applications tab with the stage Awarded, and the award gets a new row on the awards tab. The application row feeds the win rates. The award row feeds the active counts and carries the reports.
Dashboard Formulas: COUNTIFS, SUMIFS and MINIFS
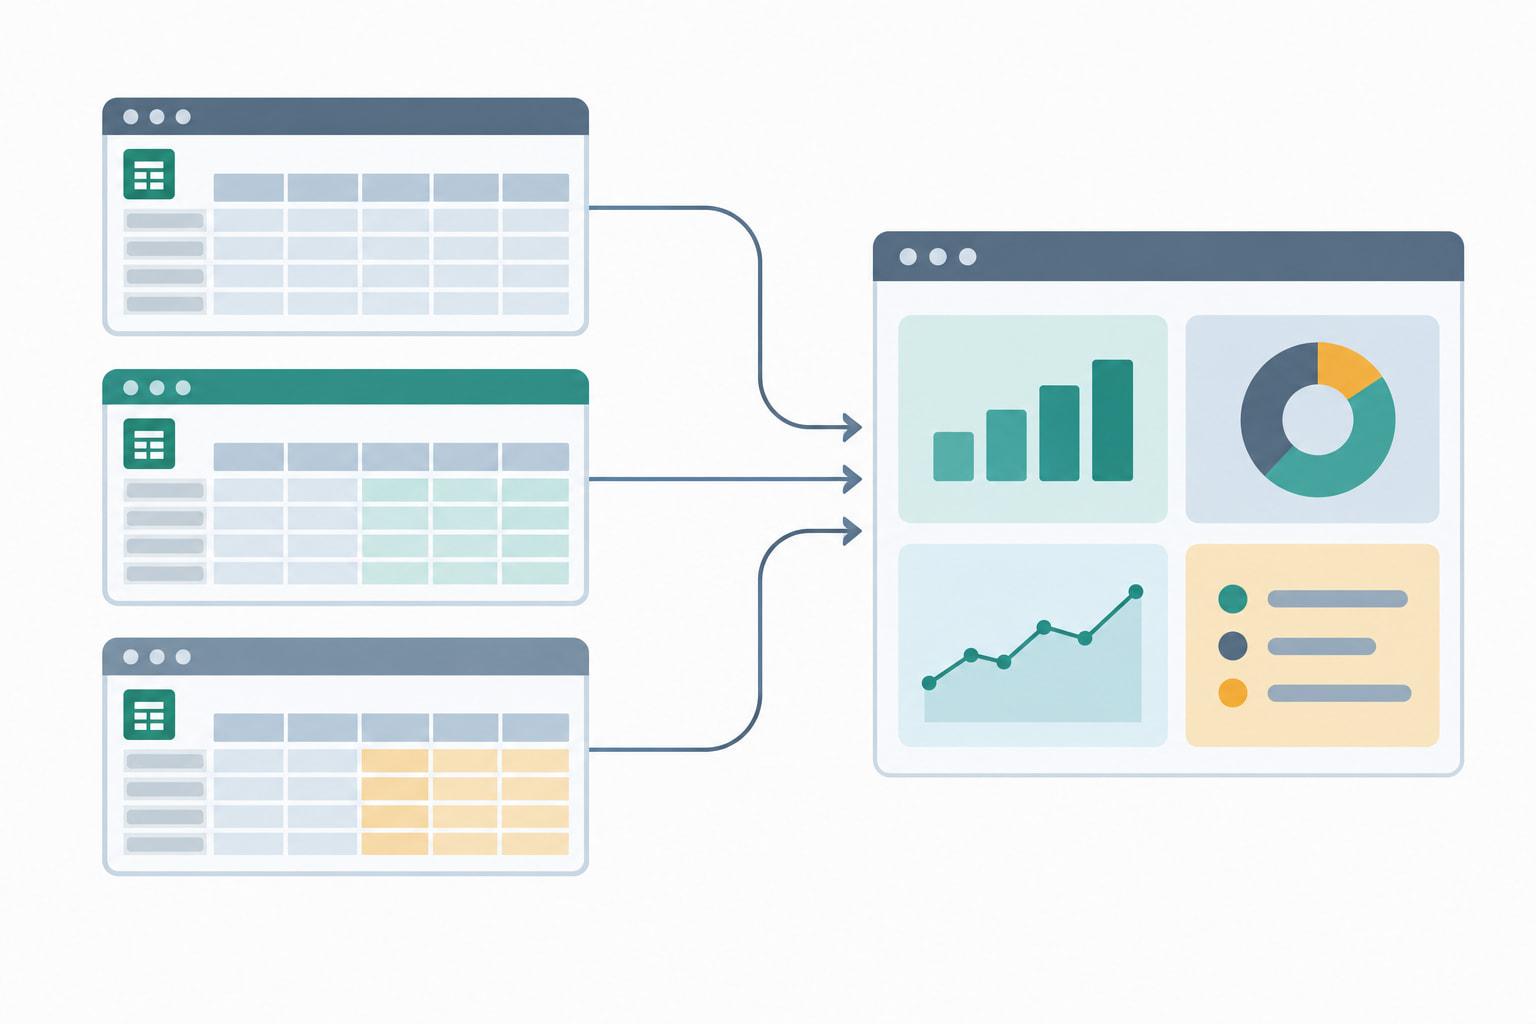
Every number on the dashboard is a COUNTIFS, SUMIFS, AVERAGEIFS or MINIFS formula over the data tabs, filtered by stage or by date and anchored to one as-of cell, so changing that cell recalculates the whole page. The data tabs are Excel tables named Applications, Awards and Reports, which keeps the formulas readable.
Six named settings cells sit at the top of the dashboard. ReportDate stays blank unless you type a date for a board packet, and AsOf reads =IF(ReportDate="",TODAY(),ReportDate), so the page shows today by default. LookAhead holds the due-soon window in days, EndingWindow the awards-ending window, StaleDays the age at which a row counts as stale, and YearStart the first day of your fiscal year. ICAEW's principle 14 gives the reason for separate cells: "Place any fixed values into separate cells and reference them within a formula" (ICAEW, 20 principles for good spreadsheet practice, 2024 edition).
The download sets LookAhead to 30 days, the same span the federal rules give a quarterly or semiannual financial report, so a quarterly report enters the due-soon count on the day its period closes (2 CFR 200.328(c)-(d), eCFR, current as of September 2026). StaleDays starts at 14, so a row counts as stale once its owner misses two weekly updates.
Two helper columns do the row-level work. Days to decision on the applications tab is =IF(AND(OR([@Stage]="Awarded",[@Stage]="Declined"),[@[Submitted on]]<>"",[@[Decision date]]<>""),[@[Decision date]]-[@[Submitted on]],""), and On time on the reports tab is =IF([@[Submitted on]]="","",IF([@[Submitted on]]<=[@[Due date]],"Yes","No")). Win rates and days to decision count only awarded and declined applications decided between YearStart and the as-of date, so withdrawn and still-open rows never dilute them and a back-dated board packet leaves out later decisions.
Conditional formatting turns the overdue count red whenever it is above zero, and turns any data check amber when it finds a problem.
A Worked Example: One Quarter-End Snapshot
A worked example shows how the numbers read together. The download ships with composite data for a nonprofit whose fiscal year starts July 1, with the report date set to June 30 and the awards-ending window set to 90 days (illustrative figures).
Illustrative figures, not data from a real organization.
The two win rates tell different stories. Five of the 12 decided applications were funded, a 41.7 percent rate by count, but only $135,000 of the $605,000 requested arrived, a 22.3 percent rate by dollars. The five wins had asked for $150,000, two of them were funded below the ask, and the seven losses had asked for $455,000. Those are average asks of $30,000 and $65,000, so the organization wins its small asks and loses its large ones. Only the pair of rates shows it.
The stage summary in the same file splits the 13 open applications into 4 prospects, 3 in writing and 6 submitted, and the 6 submitted requests make up the $412,500 pending. All three data checks read zero, so the overdue report is the one number that needs action today. Everything else on the page is planning.

Keeping the Dashboard Current
A dashboard stays current when each data row has one owner who updates it on a fixed day each week, the dashboard tab holds nothing but formulas and its settings, and someone other than the builder checks those formulas. The data checks show at a glance whether the first rule is being followed.
The download's three checks count rows on any data tab with no owner, open applications and active awards whose Last updated date is blank or older than the stale window, and open applications with no due date. A check above zero means some numbers on the page are built on rows nobody is maintaining.
Shared editing needs rules. When two co-authors change the same thing in Excel, the last change saved generally wins, and Microsoft's advice is "If you don't want to have conflicts with other people, assign areas or sheets to each person" (Microsoft Support, Collaborate on Excel workbooks at the same time with co-authoring, September 2026). Give each owner their own rows and keep everyone else off the dashboard tab.
Lock the dashboard tab, leaving only the settings cells you type into unlocked. Microsoft says worksheet protection "is not intended as a security feature. It simply prevents users from modifying locked cells within the worksheet" (Microsoft Support, Protection and security in Excel, September 2026), which is exactly the protection a formula page needs against a stray keystroke.
Have someone else check the formulas each month. ICAEW's guide on reviewing spreadsheets cites research finding that "self-review catches only 34% to 69% of errors" (ICAEW, How to review a spreadsheet, read September 2026), and its principle 18 recommends "a system of peer review" (ICAEW, 20 principles for good spreadsheet practice, 2024 edition). A reviewer can test each number by filtering the data tab by hand and comparing the count.
Keep one copy in one place. ICAEW's principle 19 calls for a regular process of backup and version control and notes that "Workbooks saved in SharePoint/OneDrive or Google Drive automatically benefit from features such as AutoSave and Version History" (ICAEW, 20 principles for good spreadsheet practice, 2024 edition). For a board packet, type the report date, save a PDF of the dashboard, then clear the date so the page returns to today.

Adapting the Template Into an SBIR Grant Dashboard
An SBIR grant dashboard uses the same three blocks once you add two columns: an Agency column on the applications and awards tabs, and a column marking each row SBIR or STTR. One more criterion in any COUNTIFS or SUMIFS then splits a metric by agency or program.
The Agency column earns its place because each agency runs its own calendar. NIH uses standard due dates of September 5, January 5 and April 5 for SBIR and STTR applications (NIH Standard Due Dates page, updated March 24, 2026), while the Department of Defense scheduled monthly topic releases in fiscal year 2026 (SAM.gov notice on the 2026 SBIR and STTR announcements, April 2026). Filtering "applications due soon" by agency shows which calendar is about to bite. Small businesses new to federal systems can start with the federal grants guide to Grants.gov.
For a startup, three numbers carry most of the weight. Days to decision tells a founder how long cash has to last between a submission and a decision. Dollars pending shows how much of next year's plan rests on answers not yet received. Next report due is the date to protect, because the award terms set the reporting schedule and nothing on the dashboard can move it.
Enter each award's reports from its own award terms, with the dates the terms set. The reports block does not care which agency or program issued the award; it counts due dates and submitted dates.
A split win rate is worth the extra column. Adding the Agency column and an agency's name as one more criterion pair, in both halves of the win-rate formula, gives a rate for that agency alone, and a founder deciding where to submit next can compare agencies on the company's own record. The SBIR and STTR grant management guide covers the program rules the dashboard does not.
Where a Spreadsheet Dashboard Stops Coping
A spreadsheet dashboard stops coping when people need to be told instead of shown. It reports to whoever opens it, and only as well as the rows were updated. One commenter in a Reddit thread suggested moving such a tracker into Microsoft Lists and connecting it to Power Automate "so it could email you reminders connected to a deadline" (Reddit thread 1vydvxu, read October 2026).
Date-based reminders are documented features of work-management tools. Smartsheet reminders "are proactively triggered by a specific date or time" (Smartsheet Learning Center, Alerts and reminders, September 2026), and monday.com documents due-date reminders "by scheduling an automation based on a date or timeline column" (monday.com Support, Alerts and Reminders with Automations, September 2026).
More editors bring a second strain. If someone opens a shared workbook in a version of Excel that does not support co-authoring, Microsoft warns, "If just one person does this, then everyone else will get the 'locked' error" (Microsoft Support, Collaborate on Excel workbooks at the same time with co-authoring, September 2026). A dashboard the team cannot open tells nobody anything.
Work-management tools can host a dashboard too, each with its own documented ceiling.
Grant software can build these views in; the grant pipeline dashboard guide shows what that looks like.
In GrantCue, the pipeline sits on a kanban board, and the dashboard jobs above come with every plan, Free included: reminders, daily and weekly digests, scheduled reports, a calendar feed, and reporting on win rate, money awarded and status with CSV and Excel export (grantcue.com pricing, October 2026). Organization adds spending against budgets from a read-only QuickBooks Online import (grantcue.com pricing, October 2026). The features page describes the reminder and reporting tools.
FAQ
What Is the Difference Between a Grant Tracker and a Grant Dashboard?
A grant tracker is the set of data tabs where people type one row per application, award or report. A grant dashboard is a separate page of formulas that summarizes those rows into a few numbers as of one date. The tracker is where work gets recorded; the dashboard is where it gets read. Keep them on separate tabs so nobody types over a formula.
Is There a Free Grant Tracker Dashboard Template for Excel?
Yes. The free download pairs an applications tab, an awards tab and a reports tab with a formula-driven dashboard showing 13 metrics, a stage summary and three data checks, all driven by one as-of date. It uses Excel tables and COUNTIFS, SUMIFS, AVERAGEIFS and MINIFS formulas, and it ships with composite sample data you delete before entering your own.
How Do You Calculate a Grant Win Rate?
Calculate it two ways for the same period. By count, divide awarded applications by awarded plus declined applications decided since the start of your fiscal year. By dollars, divide the amount awarded by the amount requested on those same decided applications. Leave withdrawn and undecided applications out of both, and read the two rates together, because small wins and large losses hide inside a single count.
How Often Should a Grant Dashboard Be Updated?
Owners should update their rows once a week on a fixed day, and the dashboard recalculates the moment they do. Once a month, someone other than the builder should test the formulas against the data tabs. Before a board meeting, type a report date into the settings cell, save a copy, and clear the date afterward so the page returns to today.
Why Does My Grant Dashboard Show the Wrong Numbers?
The usual causes are a number typed over a formula, a date entered as text, a stage spelled differently from the fixed list, a row with no owner or due date, or a report date left in the settings cell after the last board packet. Check the data checks block first, then filter the data tab by hand and compare the count with the dashboard.
Load Last Quarter's Rows, Then Read the Dashboard
Delete the sample data and load one quarter of real rows: every application decided or still open, every active award with its performance dates, and every report due in the quarter with its submitted date. Set YearStart to the first day of your fiscal year and leave the report date blank.
Read the reports block first. If the overdue count is above zero, that report is the first job of the week. Then give every row that fails a data check an owner and a date, and put the weekly update on the calendar of each person who owns rows.