Project Evaluation Examples: An Evaluation of a Project Example You Can Adapt
Three project evaluation examples with full indicator matrices, baselines, targets, data sources, and collection timing, plus the eight-column matrix behind them.
In this article (18)
- Quick Answer: What Does an Evaluation of a Project Example Look Like?
- What Every Evaluation of a Project Example Contains
- Evaluation of a Project Example: A $25,000 After-School Literacy Program
- Evaluation of the Project Example: A Two-Year Community Health Screening Initiative
- Project Evaluation Example: A One-Time Equipment Purchase
- Project Evaluation Examples by Evaluation Type
- How Goals Become the Indicators in a Project Evaluation Example
- The Project Evaluation Matrix Structure
- What Reviewers Check in an Evaluation of a Project Example
- Where Project Evaluation Examples Go Wrong
- FAQ
- What is a project evaluation?
- What is an example of a project evaluation?
- How do you write an evaluation for a project?
- What should a project evaluation report include?
- What is the difference between monitoring and evaluation?
- How much of a project budget should go to evaluation?
- Next Steps
Funders ask one version of the same question: how will you know the project worked? The fastest way to answer it is to copy the structure of an evaluation of a project example that already holds together. This page has three, sized differently: a small program grant, a two-year initiative, and a one-time equipment purchase. Each uses the same columns, so you can watch a goal turn into a number somebody can check. Every organization and figure below is a composite written for this article.
Quick Answer: What Does an Evaluation of a Project Example Look Like?
An evaluation of a project example shows how one project measures whether it worked. It names each goal, the indicator that proves progress, a baseline figure, a target, the data source, and when you collect the data. A complete example covers both process questions (was the work delivered?) and outcome questions (did it change anything?).
Free download: Project evaluation matrix workbook as Excel .xlsx. No email address required.
What Every Evaluation of a Project Example Contains
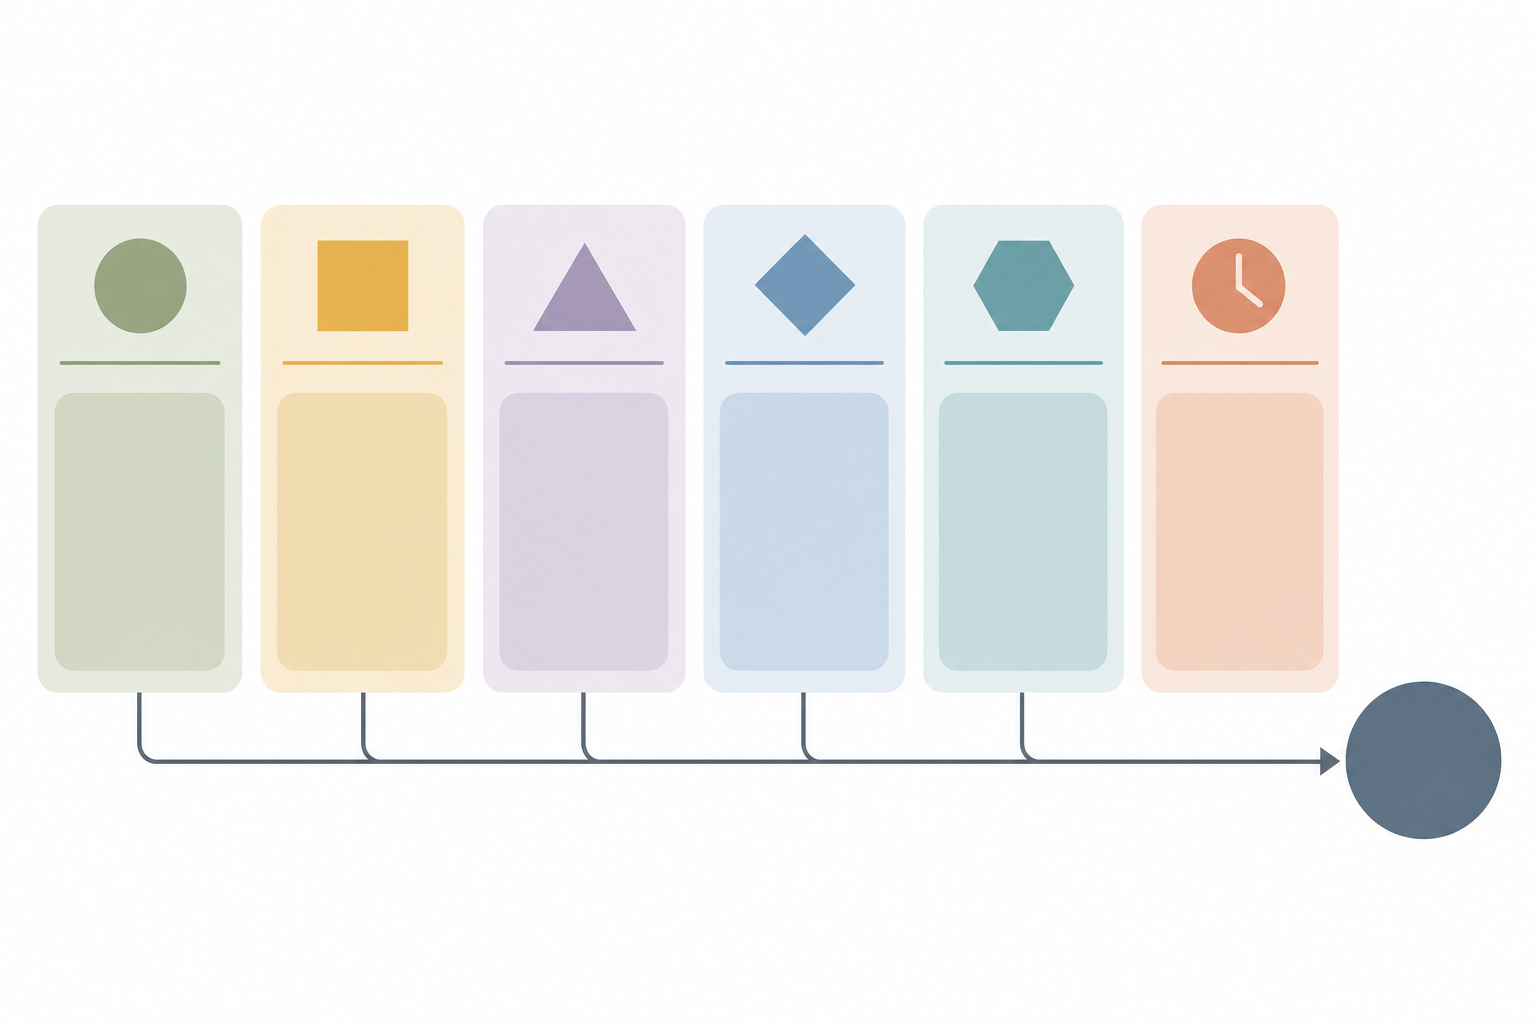
Every usable evaluation of a project example pairs each goal with one number a reviewer can verify, and says where that number comes from. The six column headings are terms of art, so the definitions matter.
An indicator is a measurable variable that shows whether a specific result occurred. Its value before the project starts is the baseline. The target is what the project commits to reaching, by a stated date. Data source just means the record or instrument the number comes from. Timing is the schedule you promise to collect on, and the goal is the change the other five columns test.
Select to enlarge (opens in a new tab).
Scroll horizontally to see all columns when needed.
| Column | Question it answers | Weak version | Strong version |
|---|---|---|---|
| Goal | What change are we after? | Improve literacy | Third graders read at grade level by June |
| Indicator | What number proves it? | Reading improves | Percent of enrolled students gaining one reading level |
| Baseline | Where do we start? | Left blank | 34 percent at grade level in September |
| Target | Where do we commit to land? | Significant gains | 60 percent at grade level in June |
| Data source | Where does the number come from? | Teacher impressions | Fall and spring running records |
| Timing | When do we collect? | Ongoing | September, January, June |
A row missing its baseline gives a reviewer nowhere to stand. Without a starting number, a 60 percent target could be a stretch or already true on the day the grant is signed. The narrative that wraps around these rows follows the shape in the grant proposal evaluation plan template.
Evaluation of a Project Example: A $25,000 After-School Literacy Program
A one-year, $25,000 after-school literacy program serving 60 students across two elementary schools needs only four indicator rows. The project has two goals. Students attend consistently, and students gain reading levels. The first is a delivery question, the second is a change question, and the matrix keeps them apart.
Scroll horizontally to see all columns when needed.
| Goal | Indicator | Baseline | Target | Data source | Timing |
|---|---|---|---|---|---|
| Enroll and retain 60 students | Students enrolled | 0 | 60 by October 15 | Program roster | Monthly |
| Students attend consistently | Percent attending 80 percent of sessions | 61 percent last year | 80 percent | Daily sign-in sheets | Monthly |
| Students gain reading levels | Percent gaining one or more levels | 34 percent at grade level | 60 percent at grade level | Fall and spring running records | September, January, June |
| Families stay informed | Percent of families reached each term | Not tracked | 90 percent | Contact log | Per term |
The plan also names who does the work. A site coordinator pulls attendance weekly, and a reading specialist scores running records three times a year. The executive director reads the mid-year table before the January board meeting. Naming an owner for each row turns a matrix into something that happens instead of something somebody wrote once.
Evaluation costs money, and this example budgets $1,200 for it: assessment materials, scoring time for the reading specialist, and a half day to write the year-end summary. Burying evaluation cost at zero is a tell that nobody plans to do the work.
Evaluation of the Project Example: A Two-Year Community Health Screening Initiative
A two-year, $180,000 project needs interim targets, because a funder who waits 24 months for a single number has no way to intervene. This evaluation of the project example sets a Year 1 figure for every row.
The composite organization runs blood pressure and diabetes screening events at churches, barbershops, and a public library, then refers people who screen high into a partner clinic.
Scroll horizontally to see all columns when needed.
| Goal | Indicator | Baseline | Year 1 target | Year 2 target | Data source |
|---|---|---|---|---|---|
| Reach residents who avoid clinics | Adults screened | 0 | 900 | 2,000 cumulative | Event intake forms |
| Find undiagnosed risk | Percent of adults screened whose reading is above threshold | Unknown | Establish rate | Hold or improve | Screening log |
| Connect people to care | Percent of high screens with a scheduled clinic visit | Not tracked | 55 percent | 70 percent | Referral tracking sheet |
| Keep people in care | Percent of scheduled visits attended | Not tracked | 40 percent | 55 percent | Partner clinic confirmation |

Select to enlarge (opens in a new tab).
The Year 1 target for one row reads "establish rate" instead of a number. That is the honest answer when no baseline exists yet, and it commits the project to producing one. The partner clinic column carries a different risk. Any indicator that lives inside somebody else's records needs a written data-sharing agreement before the proposal goes out, or the number never arrives.
Multi-year projects lose people. Put the expected attrition in the narrative, and say what you do to the denominator when the sample shrinks. A reviewer who sees a shrinking sample and no explanation will assume you kept the best cases.
Two ways of handling it both hold up, and the proposal should pick one out loud. The first keeps the denominator fixed at everyone who ever enrolled, so anyone who leaves counts against the target. The second reports on everyone still enrolled at the measurement point, which flatters the rate, so it only works if you also report how many people left. Either choice survives review. A reviewer who cannot tell which one you made will discount the number.
Project Evaluation Example: A One-Time Equipment Purchase
Funders evaluate equipment grants too, and the common mistake is treating the purchase itself as the outcome. This project evaluation example covers a $14,000 commercial refrigeration unit for a composite food pantry that currently turns down fresh produce donations it cannot store.
Scroll horizontally to see all columns when needed.
| Goal | Indicator | Baseline | Target | Data source | Timing |
|---|---|---|---|---|---|
| Install and commission the unit | Unit installed and inspected | Not installed | Complete within 90 days | Vendor invoice, inspection record | One time |
| Move more fresh produce | Pounds of produce distributed monthly | 2,100 pounds | 5,000 pounds | Warehouse intake and outflow log | Monthly |
| Cut spoilage loss | Pounds discarded as spoiled | 380 pounds monthly | Under 150 pounds | Discard log | Monthly |
| Serve more households | Households receiving produce weekly | 145 | 260 | Client sign-in system | Monthly |
Buying the unit is an activity. The result sits on the far side of the purchase, in pounds moved and households served. Write the indicator there. One row for installation is enough to prove the money was spent as promised.
Capital requests have one advantage: the baselines usually exist already. A pantry that weighs incoming donations has a spoilage figure sitting in its own logs, and the intake system already counts households. Pull twelve months of those numbers and attach the period to each one, because "2,100 pounds" means nothing until it says "per month, averaged over the last year."
The risk running the other way is claiming a change the equipment cannot produce by itself. A refrigerator does not recruit donors. If the pounds-distributed target depends on a produce donor the pantry has not signed yet, put that agreement in the project timeline. The safer alternative is a Year 1 target set at what current donations would fill.
Watch the timing column on a purchase like this. A unit installed in month three leaves nine months of logs to compare against a baseline year. A grant that ends 60 days after installation cannot show a distribution change, so the honest indicator for that period is installation, inspection, and the first month of throughput.
Project Evaluation Examples by Evaluation Type
Project evaluation examples fall into a few types, and most proposals need two: one that watches delivery and one that measures change.
A process evaluation checks whether the planned activities happened as designed. An outcome evaluation asks whether anything changed for the people served.
Scroll horizontally to see all columns when needed.
| Type | Question it answers | When it runs | Example indicator |
|---|---|---|---|
| Process | Did we deliver what we promised? | Throughout | Sessions held against sessions planned |
| Outcome | Did anything change for participants? | End of period, with a mid-point read | Percent gaining a reading level |
| Formative | What should we adjust while there is still time? | First third of the project | Staff and participant feedback themes |
| Summative | Was the whole project worth repeating? | End of grant | Cost per participant served, outcome rate |
| Participant experience | Did people find it usable and respectful? | Quarterly | Percent rating access as easy or very easy |
Small projects rarely need all five. A process row plus an outcome row covers the question the evaluation section exists to answer. If your activities and outcomes are not yet mapped to each other, build them side by side first using a logic model template, then convert the right-hand column into indicators.
How Goals Become the Indicators in a Project Evaluation Example
The indicator comes out of the verb in the goal. If the goal says increase, the indicator is a count or a percentage measured at least twice, and the evaluation section has to say when.
Work through it in four steps:
- Underline the verb and the noun in each goal. "Increase attendance" gives you a count of attendees and a comparison over time.
- Decide whether the number is a count, a percentage, or a rate. Percentages need a stated denominator, so write it into the indicator cell itself.
- Find the record that already holds the number. Sign-in sheets, case notes, and intake forms beat any instrument you would have to invent.
- Set the target against the baseline, not against a wish. A target with no visible relationship to the starting number reads as decoration.
Goals written as vague intentions produce vague indicators, which is why the evaluation matrix is easier to fill in once you have tightened the objectives. That pattern is in these SMART goals and objectives examples. Once the rows are set, the surrounding evaluation plan is mostly narration of the table.
The Project Evaluation Matrix Structure
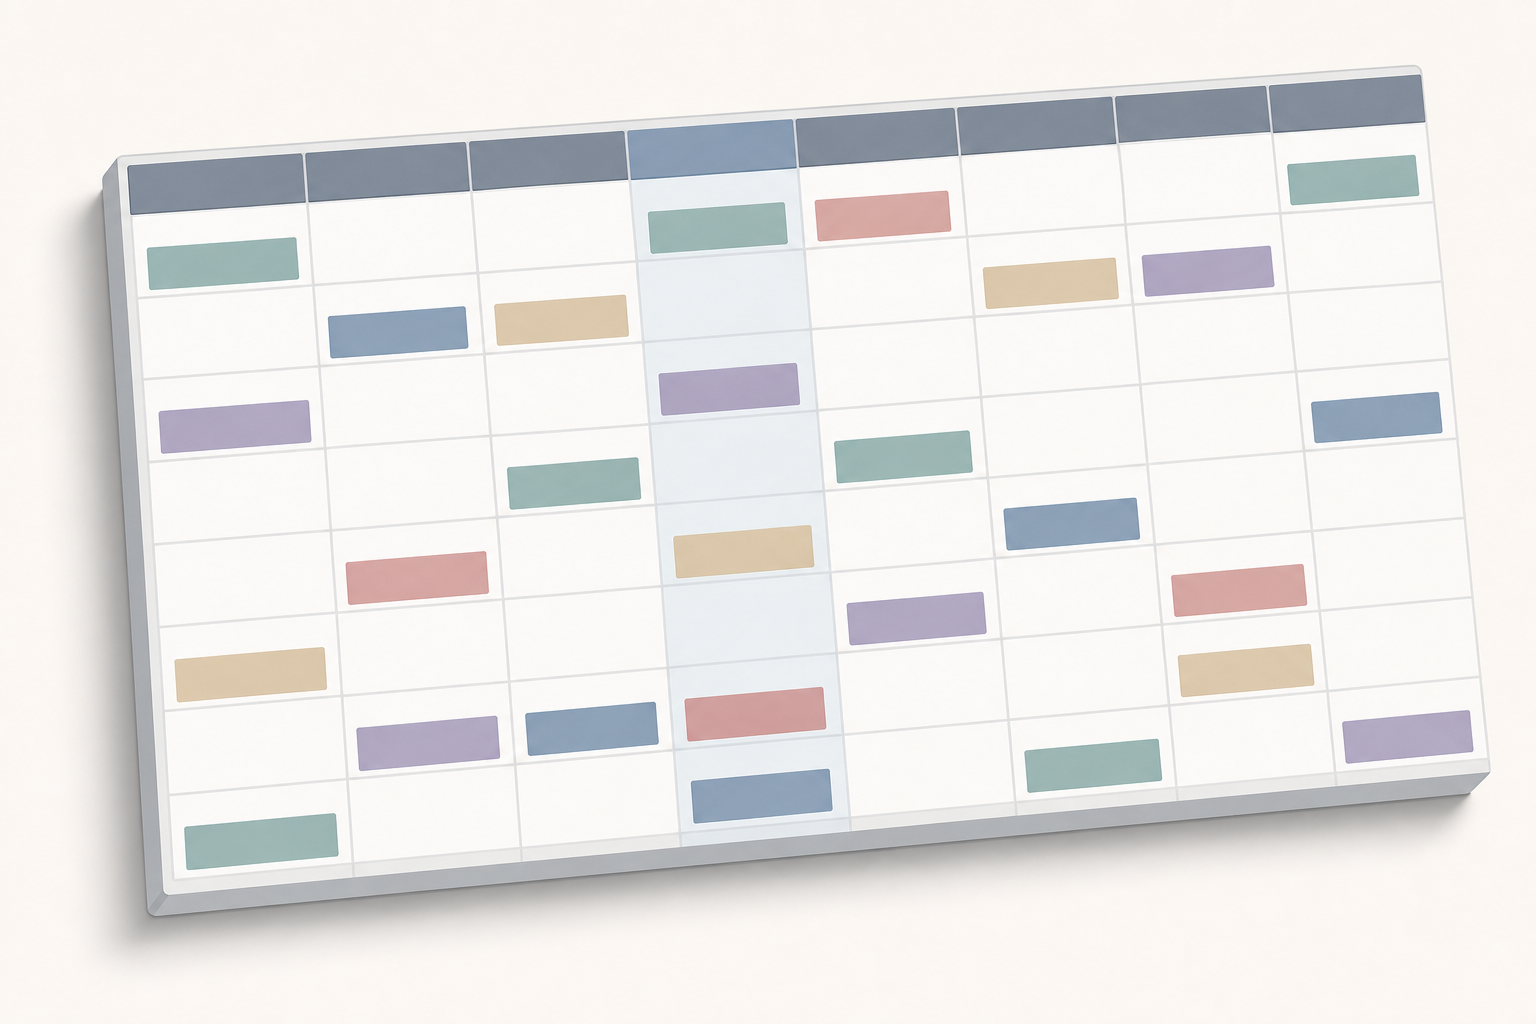
A working project evaluation matrix has eight columns: goal, evaluation type, indicator, baseline, target, data source, collection timing, and owner. The worked examples on this page show six of them, and the two extra columns are the ones teams leave out and then miss.
Select to enlarge (opens in a new tab).
Evaluation type labels each row process, outcome, formative, summative, or participant experience, which stops a team from filling the whole table with delivery counts and calling it an outcome plan. Owner puts a role in every row.
Keep the wording of the type and timing entries identical across rows. If one row says quarterly and another says every three months, it becomes two schedules once three staff members maintain it.
Build the grid once per project and keep a blank copy of the headings. An empty row of the right shape keeps the first draft from turning into a list of activities. On multi-year projects, lay the collection points across twelve months and check whether every deadline lands in the same two weeks.
What Reviewers Check in an Evaluation of a Project Example
Reviewers move fast through an evaluation matrix, and six checks decide whether it holds: one indicator per goal, a real baseline, a data source that already exists, a named owner, timing that beats the report deadline, and evaluation cost in the budget.
Scroll horizontally to see all columns when needed.
| What they look for | What fails the check |
|---|---|
| One indicator per goal | A goal with no measurement attached |
| A real baseline | "Not tracked" with no plan to establish it |
| An existing data source | A survey that has not been written or tested |
| A named owner | Passive language with no role attached |
| Timing that matches the report schedule | Data collected after the report is due |
| Evaluation cost in the budget | A $0 evaluation line |
The last two rows are the ones an internal reviewer can catch before submission. If the evaluation section describes quarterly surveys and the budget has no line for analysis time, the two documents contradict each other, and reviewers read budgets. The rest of the application has to stay consistent with the evaluation section too, which is easier when you draft the evaluation alongside everything else. The full sequence is in the guide on how to write a grant proposal.
Where Project Evaluation Examples Go Wrong
Evaluation sections fail in a small number of predictable ways, and the biggest is measuring effort instead of effect. Counting workshops held tells a funder the money was spent, not that anything changed.
- Outputs standing in for outcomes. Sessions delivered is a process indicator. Pair it with a change indicator or the section reads as activity reporting.
- Targets floating without a baseline. Reviewers discount an unanchored target, because nothing on the page says how much work it represents.
- Data owned by somebody else. Partner records need an agreement in writing before submission. A clinic that verbally agreed in June can have a new compliance officer by January. Get it signed, and name the agreement in the proposal.
- An instrument that does not exist yet. A validated tool named in the proposal has to be one you can access on the timeline you wrote.
- Collection timing that misses the report. If the post-test runs in July and the report is due in June, the number will never appear.
- No plan for a missed target. Say what you would investigate if the number came in low, and who would look at it. A project that can name its own failure modes gives a program officer something to do besides worry.
Once an award lands, the same rows become the reporting schedule. If the deadlines, owners, and collection dates are already in one place, the report takes an afternoon. If they are not, somebody rebuilds them from memory in the last week. GrantCue keeps those deadlines, owners, and tasks alongside the opportunities you search across federal and state portals.
FAQ
What is a project evaluation?
A project evaluation is a structured assessment that determines whether a project delivered its planned activities and produced its intended results. It compares measured indicators against baselines and targets set before the work began, and it draws on data sources named in advance.
What is an example of a project evaluation?
An example is a one-year literacy program that tracks four indicators: students enrolled, percent attending 80 percent of sessions, percent gaining a reading level, and percent of families contacted each term. Each one has a baseline, a target, a source, and a collection schedule.
How do you write an evaluation for a project?
List each goal, attach one measurable indicator to it, record the current value as the baseline, set a target with a date, name the record the number comes from, and assign a person and a collection schedule. Write the narrative after the table is complete.
What should a project evaluation report include?
A project evaluation report includes the original targets, the actual results, the data sources used, an explanation of any variance, changes made during the period, and what the organization intends to do next. Explain the misses, and say what you changed in response.
What is the difference between monitoring and evaluation?
Monitoring is the continuous tracking of activity and output data during a project. Evaluation is the periodic judgment of whether those activities produced the intended change. Monitoring feeds evaluation, and both belong in the same matrix.
How much of a project budget should go to evaluation?
There is no universal figure. Check the funder's guidelines first, since some publish a cap or an expectation. What matters more is that the evaluation line covers the staff time to collect and analyze the data you promised.
Next Steps
Copy the eight-column matrix into a spreadsheet, open the worked example closest to your project, and replace the numbers with yours before writing a sentence of narrative. Filling the table first makes the narrative almost automatic, because the paragraph is just the row read aloud.
When the rows are set, wrap them in the full write-up using the evaluation plan template and examples, then keep the same indicators and dates as your reporting schedule after the award arrives.